SurWay: The MERN Survey App That Turns Anonymous Cab-Driver Reports Into Collective Visibility
A lean React and Node project shows how far a first real app can go when the goal is not generic forms, but labor transparency, hardcoded discipline, and just enough aggregation to make patterns visible.

- SurWay treats anonymity as a product feature, not a compromise, and that choice is both its biggest strength and its biggest risk.
- The backend mixes MongoDB aggregation with plain application logic, which makes the data pipeline small, legible, and slightly improvised in a useful way.
- The chart is the point of the app, because it turns private submissions into shared labor visibility instead of just storing form responses.
- SurWay is best understood as a first React app that ships a narrow workflow cleanly enough to matter.
The app asks for trust before it asks for proof
SurWay is interesting because it does not try to solve surveys in general. It solves one fragile problem: cab drivers can report their work patterns anonymously, and the app turns those reports into a visible collective picture.
That is a useful thing to build, but it comes with a trade-off. The more open the system is, the easier it is to participate. The easier it is to participate, the harder it is to trust every submission.
SurWay is a survey/polling website for cab drivers where they can report their typical work hours and which company they work for, this data is then stored anonymously and used to generate charts and insights.
What SurWay collects, and what it refuses to collect
The data model is intentionally narrow: working hours, working days per week, and company affiliation. That is not a limitation of the idea. It is the idea.
The schema is a product decision. Fewer fields mean less friction, less ambiguity, and less reason for a driver to bounce before submitting. It also makes the output easier to read because the app never pretends it has more evidence than it really does.
const CabbieSurveySchema = new mongoose.Schema({
  working_hours: Number,
  work_days_in_week: Number,
  company: String
}, { timestamps: true });
The backend does two things at once
The summary endpoint is the most revealing part of the repo. It uses MongoDB aggregation to calculate average hours and days, then falls back to a manual find-and-loop pass to count company occurrences.
That hybrid approach is not elegant in the abstract. It is practical in the context of an MVP, where numeric rollups belong in the database and categorical grouping can stay in application code until the data model hardens.
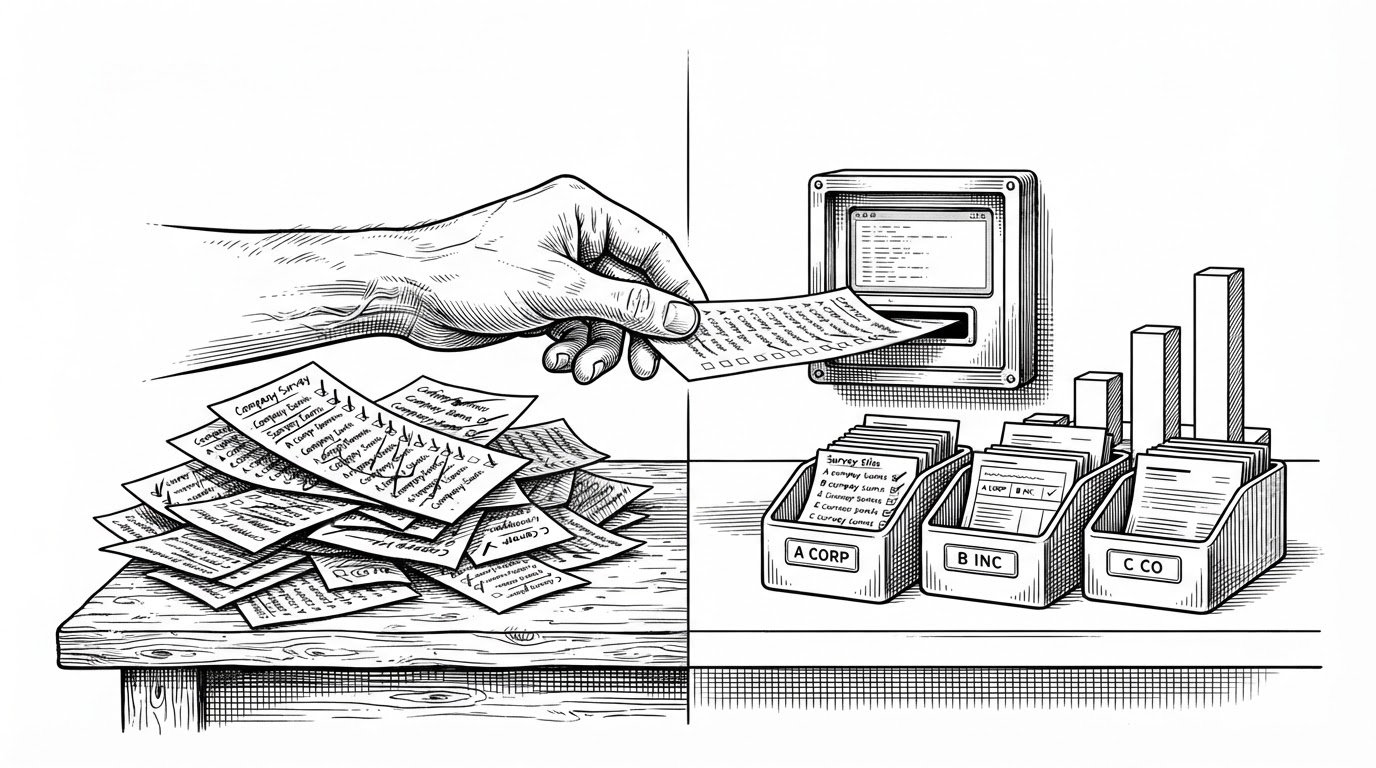
That choice also exposes the developer’s transition from tutorial logic to product logic. The app is not over-abstracted, but it is past the point where every line exists only to prove a concept.
Why the chart matters more than the form
The frontend is where the product argument becomes visible. `ChartsComponent` is not decoration layered on top of a form. It is the payoff, because it gives each driver an immediate aggregate view after submitting data.
That matters in a labor context. A form collects input. A chart changes what the input means by making the pattern public.
In other words, the app does not just store reports. It creates a shared reference point. That is the difference between a survey and a visible instrument.
A first React app that actually ships a workflow
Rohan Sawant describes SurWay as a first React app, and the repo reads like that kind of milestone in the best way. It uses the MERN stack, `create-react-app`, Docker Compose, and Heroku deployment to cross a threshold that many learning projects never cross: a complete workflow that accepts data, stores it, summarizes it, and serves the result back out.
That is why the repo feels more like a product sketch than a toy. It is still small, but it has a clear opinion about what should happen next.
The general idea was to add several features like browser finger printing and SSO to ensure that a single user could be allowed to cast a vote only once. But, I decided to postpone these features for a future release.
That decision is important. Stronger identity checks would improve integrity, but they would also raise friction in a space where friction can kill participation.
SurWay versus generic survey tools
SurWay makes more sense when compared with broad survey platforms than when judged on enterprise feature depth. It is narrower on purpose.
| Product | Primary goal | Strength | Weakness | Why SurWay differs |
|---|---|---|---|---|
| Google Forms | Quick form collection | Ubiquitous and easy to use | Not built for domain-specific labor visibility | SurWay turns submissions into a public labor pattern, not just responses |
| LimeSurvey | Flexible survey creation | Powerful logic and mature tooling | Heavier setup and broader scope | SurWay is a single-purpose app with a much smaller surface area |
| JD Esurvey | Enterprise survey operations | High-volume structured collection | Built for larger organizational workflows | SurWay is lightweight, self-hosted, and opinionated about one audience |
| SurWay | Cab-driver transparency | Anonymous reporting with immediate charts | Trust is fragile without stronger anti-abuse controls | It is designed around a specific social use case, not generic polling |
The comparison sharpens the category. SurWay is not trying to beat Google Forms at being a form builder. It is trying to make a very specific kind of hidden work easier to see.
What this repo teaches
SurWay is a useful reminder that small tools can matter when the problem is specific enough. The codebase is modest, but the product judgment is real: keep the schema lean, keep the workflow simple, and let the chart do the political work.
That is a strong lesson for developers building their first serious app. Clarity beats excess when the audience is narrow and the stakes are social.