customer-churn-analytics-dashboard: Customer Churn Analytics Platform: Turning a Churn Model Into a Decision System
A Streamlit app that predicts churn, explains model behavior, and translates telco data into business actions with domain-driven feature engineering and XAI.
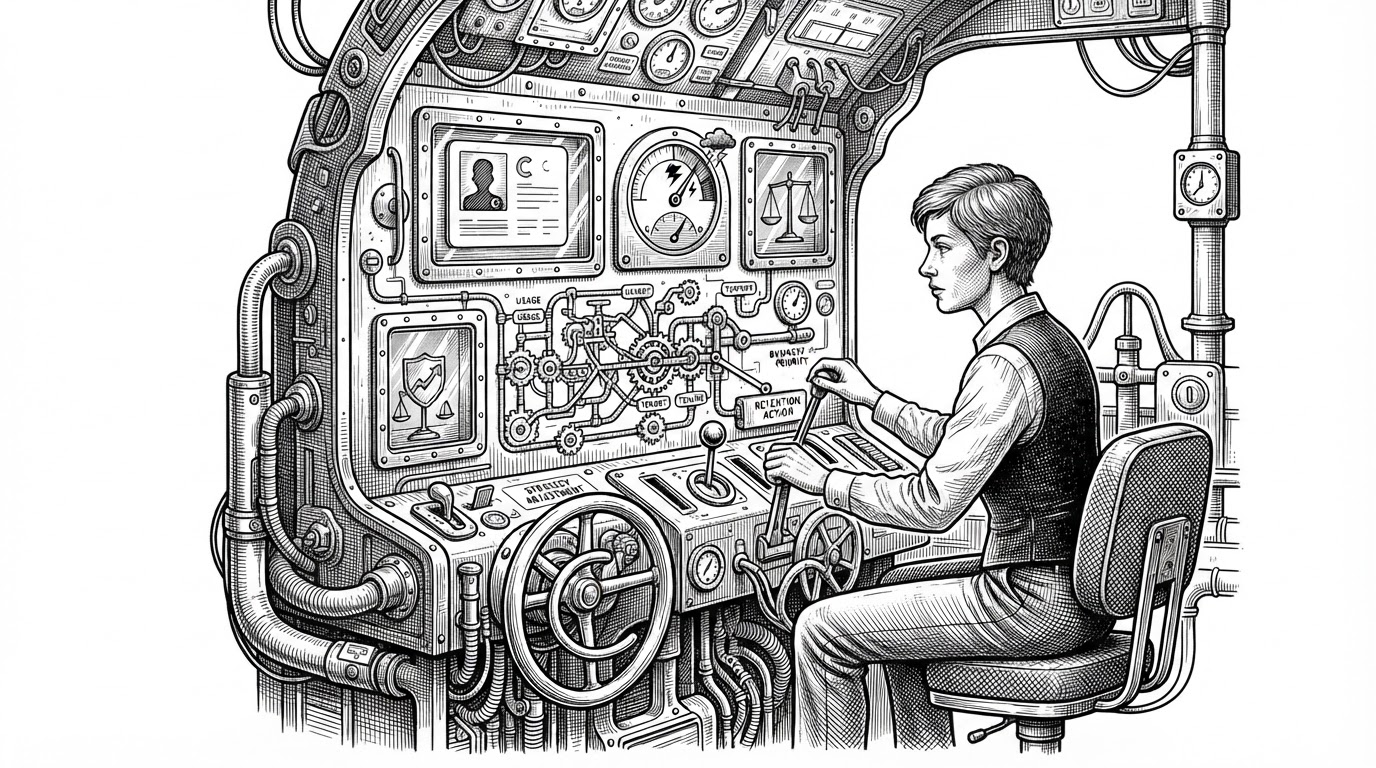
- This repo treats churn prediction as a retention workflow, not a model output page.
- Its strongest move is to encode business judgment into features like engagement, lifetime value, and contract risk.
- Explainability is not bolted on here, it is part of the product surface through SHAP and coefficient views.
- The project feels portfolio-grade because the UI, serialized artifacts, and page structure already resemble a real analytics tool.
The real product is not churn prediction
Most churn apps answer one question: who might leave? This one tries to answer three at once. It predicts churn for an individual customer, frames the business risk in portfolio terms, and explains why the model is leaning that way.
That changes the shape of the product. Instead of a black box score, you get a retention cockpit that is meant to support action. For a PM or founder, that is the difference between a model demo and something a team could actually use.

Why this is a glass box, not a black box
The repo pairs two kinds of interpretability. SHAP provides global importance, while Logistic Regression gives directional coefficients that are easier to read as business signals. That combination matters because it gives the UI both a ranking of drivers and a simpler story about whether a feature pushes risk up or down.
| Conventional churn tool | This repo | Why it matters |
|---|---|---|
| Shows churn probability | Shows churn probability plus explanation and business framing | Teams can act on the result instead of just observing it |
| Feeds raw fields into a model | Adds engineered signals like CLV, EngagementScore, and ContractRiskScore | The model learns from business judgment, not only raw dataset columns |
| Treats interpretability as a separate report | Builds SHAP and coefficients into the app experience | Trust arrives inside the workflow, not after it |
| Feels like a notebook export | Feels like a productized Streamlit application | The interface is closer to something a stakeholder could actually use |
| Optimizes for prediction alone | Optimizes for prediction, trust, and actionability | That is the real gap between ML demos and decision systems |
| Often hides preprocessing | Keeps preprocessing artifacts serialized and aligned with inference | Training and serving stay consistent |
The smartest part is the feature engineering
The repo does not stop at the IBM Telco fields. It creates CLV, EngagementScore, and ContractRiskScore, which is the real tell that the author is encoding retention intuition into the model. That is a stronger move than simply tuning a classifier.
Why it works: churn is not just a pattern in the data. It is a business judgment about loyalty, value, and friction. A customer with high monthly charges, short tenure, and a risky contract type should not look the same to the model as a long-tenured customer with broad service adoption.
How the pipeline is wired
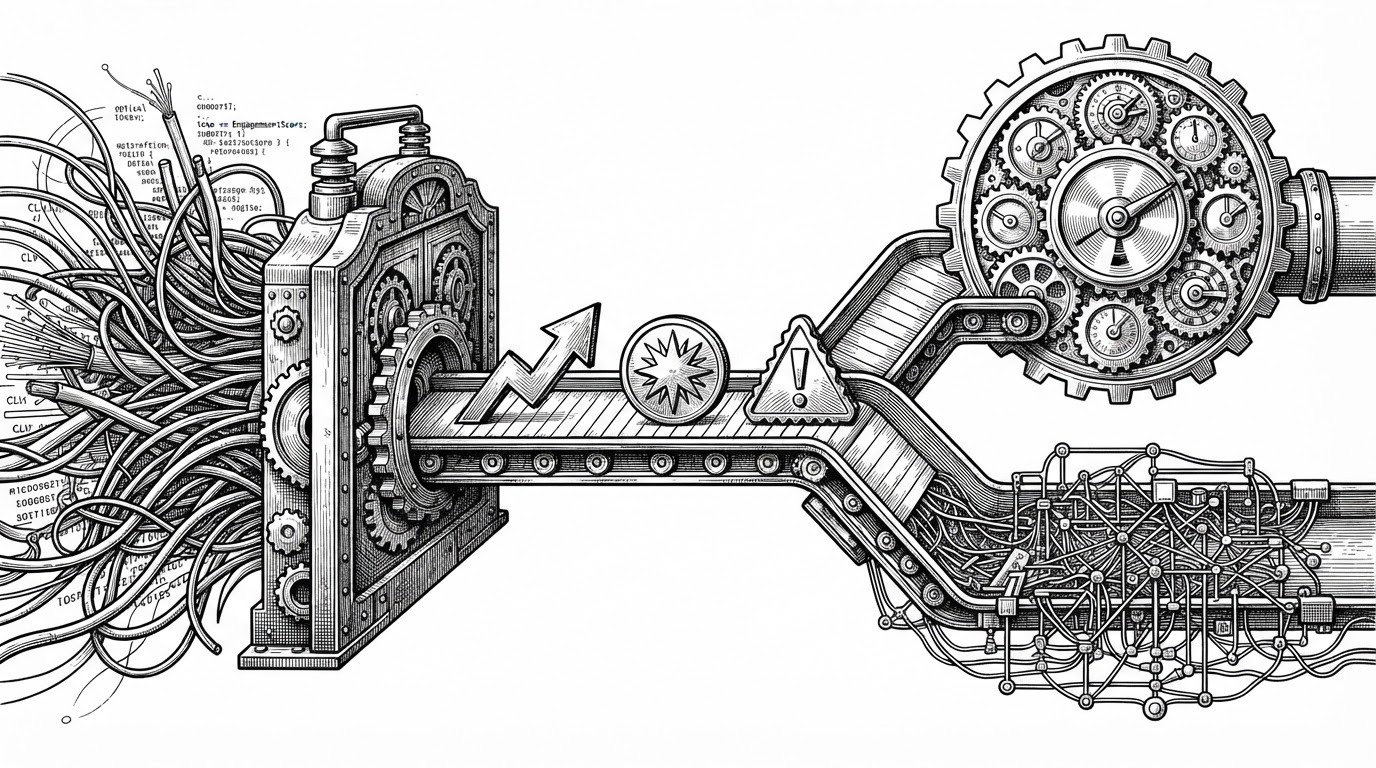
The app is built as a modular Streamlit project with a serialized preprocessing pipeline and saved models. The important part is not the file format. It is the discipline: training-time transformations are preserved and reused at inference, so the customer view in the app matches what the model actually expects.
Under the hood, a ColumnTransformer splits numeric and categorical features. Numeric inputs get scaled, categories get one-hot encoded, and the transformed output is passed into the model stack. That keeps the serving path aligned with the training path, which is exactly where many lightweight ML apps drift into inconsistency.
# Conceptual flow from the repo's architecture
numeric_features = ["tenure", "MonthlyCharges", "TotalCharges", "CLV", "EngagementScore"]
categorical_features = ["InternetService", "PaymentMethod", "Contract", "gender"]

preprocessor = ColumnTransformer([
    ("num", StandardScaler(), numeric_features),
    ("cat", OneHotEncoder(handle_unknown="ignore"), categorical_features),
])

X_transformed = preprocessor.fit_transform(X_train)
prediction = model.predict(X_transformed)
What a stakeholder sees versus what the model sees
This repo is really about translation. The stakeholder sees polished metrics, charts, and clear labels. The model sees encoded features, transformed vectors, and coefficient space. Streamlit and Plotly make the front end feel like SaaS, while the underlying stack stays lightweight and easy to reason about.
| Stakeholder view | Model view | Effect |
|---|---|---|
| Business metrics and retention signals | Scaled numeric features and one-hot encoded categories | The output reads like a business conversation |
| Clear labels such as Fiber Internet Service | Encoded columns such as cat__InternetService_Fiber optic | Technical detail is hidden without being lost |
| KPI cards and plots | Serialized artifacts and feature vectors | The UI feels friendly, the pipeline stays reproducible |
| Risk priorities for customers | Predicted class and importance scores | Teams get a decision, not just a probability |
What makes the repo feel production-minded
The project is still a prototype, but it has the bones of a real analytics product. The .devcontainer signals reproducibility. The saved artifacts signal a deliberate boundary between training and serving. The page split signals that the author is thinking in product modules, not notebook cells.
That matters because churn tooling is only useful when the workflow survives beyond experimentation. A retention team needs consistency, legibility, and a path to iteration. This repo already points in that direction, even without live infrastructure or authentication.
| Prototype trait | Production-minded trait | Why it matters |
|---|---|---|
| Ad hoc notebooks | Serialized model and preprocessing artifacts | Inference can stay stable over time |
| Single analysis screen | Separate pages for prediction, analytics, and intelligence | Users can move from question to action |
| Manual environment setup | Dev container support | Onboarding gets simpler and less fragile |
| Raw model output | Human-readable feature mapping | Trust improves across non-technical users |
The limits are also the roadmap
The next obvious steps are not mysterious. Live data, authentication, and a database-backed workflow would move this from a polished V1 into a system that can support real teams. Right now the repo proves the product thinking. The next version would prove the operating model.
- Wire the app to live customer data instead of static artifacts.
- Add authentication and role-based access for retention teams.
- Store decisions and outcomes in a database for auditability.
- Track model drift so the explanation layer stays trustworthy.