Defensive-Packing-Pass-Network-Disruption-Index: The metric that turns pressing into a graph attack
NavjotML’s model scores defenders not just for winning the ball, but for breaking the opponent’s passing structure, especially when the target is a central node.
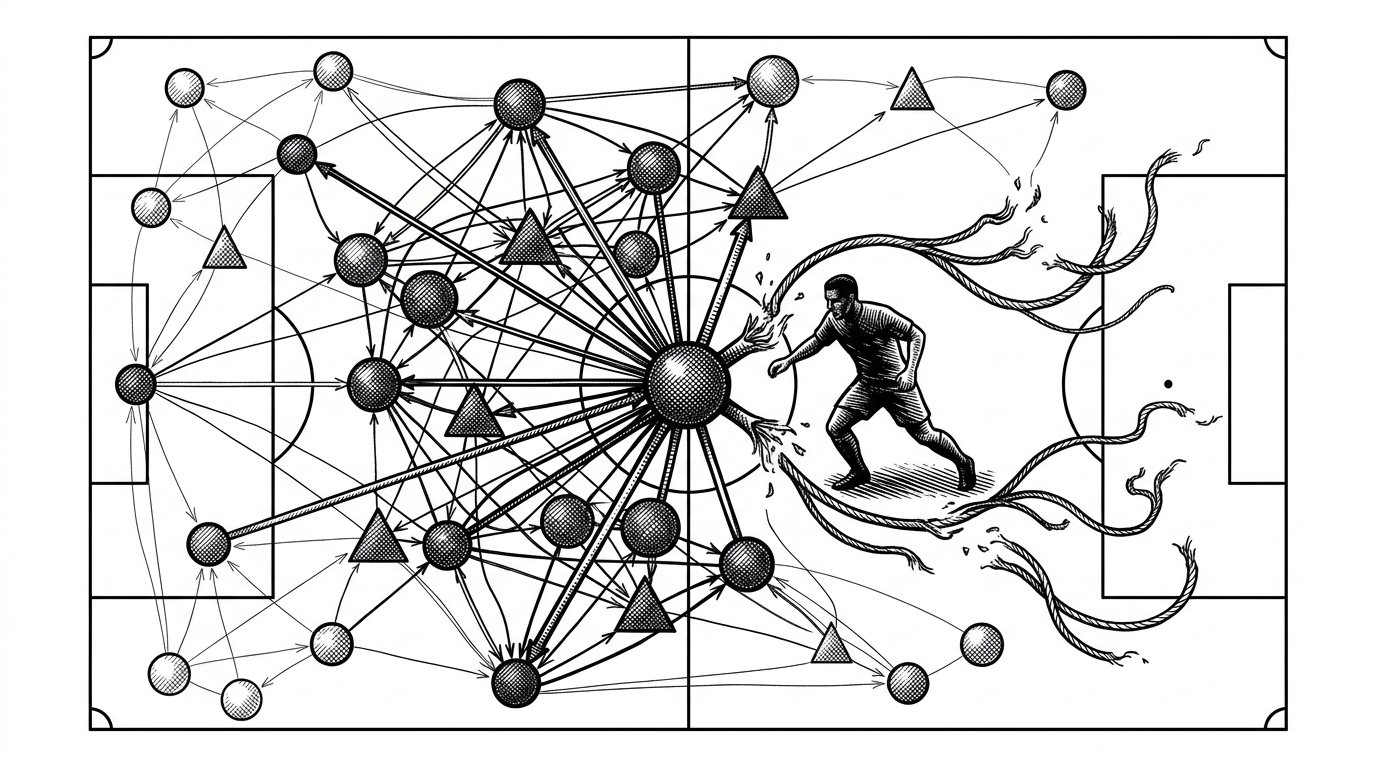
- This repo treats defense as network sabotage, not as a tally of tackles or pressures.
- Its real leap is weighting a press by the passing importance of the player it targets.
- Freeze-frame context and centrality scores let the model value structural damage instead of raw defensive volume.
- The dashboard turns that idea into something analysts can inspect sequence by sequence.
Most defensive metrics ask a blunt question: did the press win the ball? This repo asks a sharper one: who did the press shut down inside the opponent’s passing graph? That shift matters because a press on a hub player can change the shape of an attack even when it does not end the possession.
The project aims to quantify the disruptive impact of defensive actions on opposition passing networks.
The hidden trick: pressing the player who matters most
The repo’s reversal is elegant. Packing usually describes how much ground an attack eliminates. Here, the logic flips. A defender is rewarded for making the opponent’s passing network smaller, flatter, and less useful.
That is why the model cares about centrality. Pressing a fringe player is cheap. Pressing a high-value connector, like a hub with strong PageRank, can damage the entire possession structure.

Why classic pressing stats miss the point
Press success rate, tackles, and interceptions are useful, but they are narrow. They often reward the final event and ignore the chain reaction that came before it. A press can fail to win the ball and still force the opponent into a worse passing shape.
| Metric | What it values | What it misses | Best use case |
|---|---|---|---|
| Classic packing | How many opponents an action bypasses | Defensive structure and target importance | Attacking progression |
| Press success rate | Whether the press ended in a turnover or error | Partial disruption and hidden pressure | Basic defensive summaries |
| Tackles and interceptions | Visible ball-winning events | The wider network effect of the action | Traditional box score style analysis |
| Disruption Index | How much a defensive action breaks the passing structure | Some tracking-level nuance and data quality issues | Valuing structural defensive impact |
The difference is not cosmetic. In the final third or a compact mid-block, the cost of a failed press can be tiny if it still cuts the opponent’s best options. The repo tries to measure that hidden value instead of throwing it away.
How the Disruption Index works
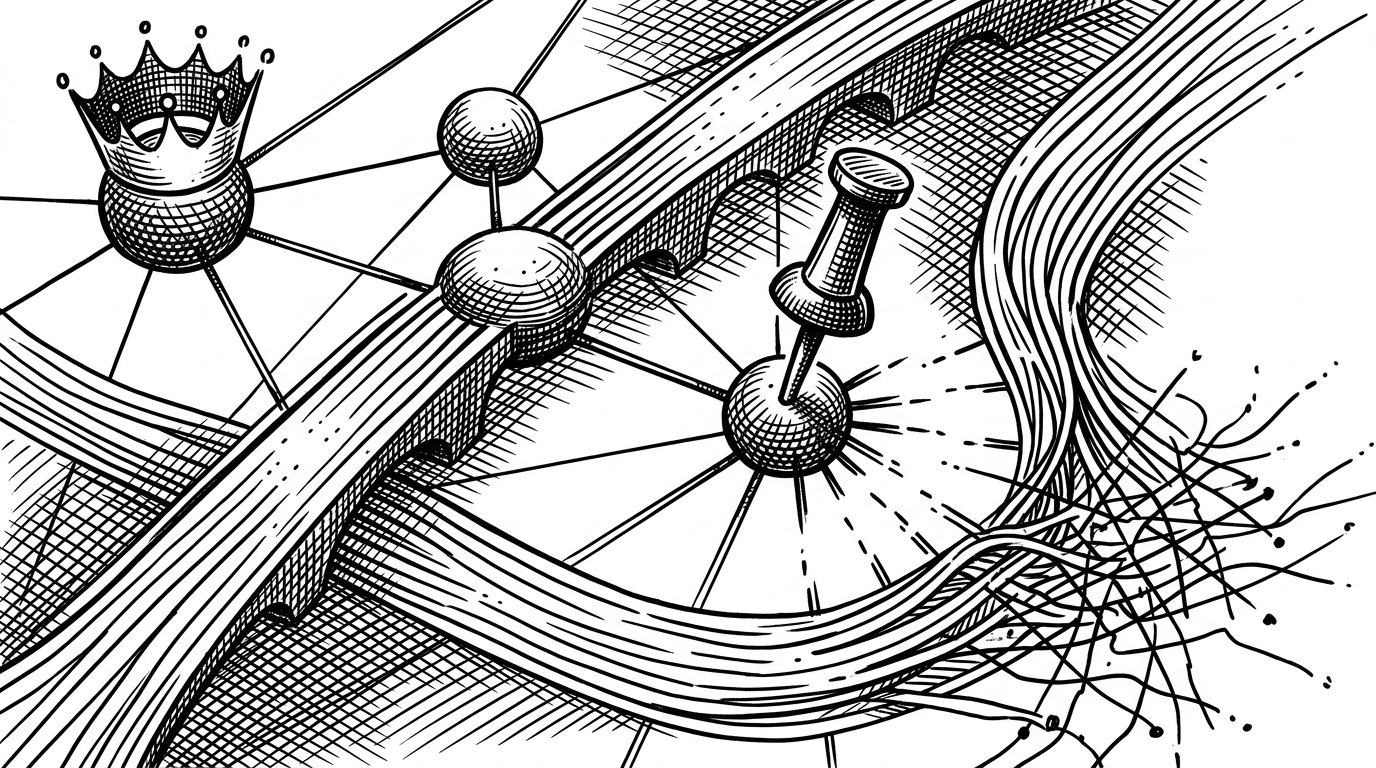
df['combined_press_value'] = (0.40 * spatial_packing + 0.35 * lanes_cut + 0.25 * network_importance)That formula does the editorial work of the project. Spatial packing captures the local defensive squeeze. Lanes cut captures immediate blockage. Network importance adds the missing layer, which is the structural weight of the player being pressured.
This is why the repo feels more like a research instrument than a dashboard toy. It turns a football action into a composite value that reflects both geometry and graph position.
The network engine behind the metric
Under the hood, the repository precomputes network metrics for players across matches. PageRank estimates which nodes matter most in the passing flow. Betweenness picks out the bridges that connect otherwise separate parts of the attack.
That matters because the model is not guessing importance on the fly. It is loading structural context from processed data, then using that context to score defensive actions more intelligently.
import networkx as nx

# passing network centrality
pagerank = nx.pagerank(G, weight='weight')
betweenness = nx.betweenness_centrality(G, weight='weight')
The repository’s data footprint shows the same ambition. It is built around processed match sequences, network metrics, and a Streamlit layer that can explore thousands of defensive moments without turning the experience into a static report.
What the dashboard actually lets you do
The Streamlit app is the research surface. Analysts can inspect press sequences, compare players, review model outputs, and move between tactical maps and diagnostic plots without leaving the same interface.
That design choice matters. The repo is not only proposing a metric. It is packaging a workflow around it, so the idea can be tested against match context instead of staying abstract.
- Sequence-level press value for individual actions.
- Player and match filters for tactical comparison.
- Model diagnostics such as SHAP and ROC outputs.
- Pitch visualizations for press maps and defensive patterns.
Where this beats packing, and where it does not
The Disruption Index wins when the question is defensive value. Packing is a great attacking lens, but it is not built to reward a press for destabilizing a key passing hub. This repo is.
| Question | Better tool | Why |
|---|---|---|
| How much progress did the attack make? | Packing | It measures bypassed opponents directly |
| How much did the press destabilize the opponent? | Disruption Index | It values the press by network damage |
| Did the defender win the ball? | Press success rate | It is a simple outcome metric |
| Which action changed the opponent’s options most? | Disruption Index | It combines space, lanes, and centrality |
It still has limits. It depends on freeze-frame availability, event quality, and the assumptions baked into the weighting formula. That is not a flaw to hide. It is the price of making defensive context measurable from event data.
What this repo says about the future of defensive data
The larger lesson is not about one formula. It is about where football analytics is heading. The next useful defensive metrics will care less about raw event counts and more about structure, context, and downstream damage.
Full tracking data will make this cleaner. Until then, NavjotML’s repo is a strong bridge. It shows how far you can get by combining open event data with graph theory and a clear tactical question.