NamasteSandbox: Glassbox Turns Python Execution Into a Self-Explaining Debugger
A deep look at how `sys.settrace`, object sanitization, and LLM reasoning work together to turn line-by-line execution into a teaching tool that can narrate code, visualize data structures, and probe real runtime complexity.
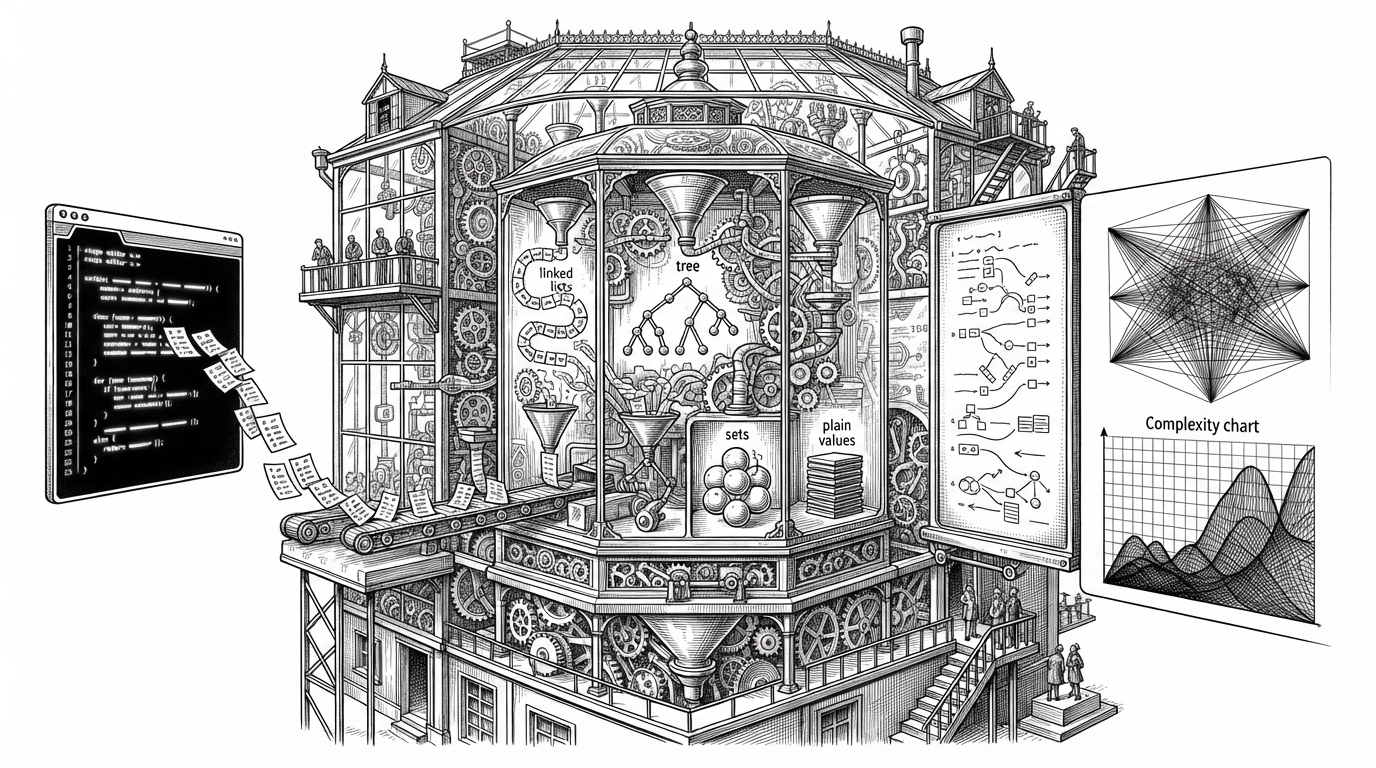
- Glassbox fuses tracing, sanitization, and LLM narration into one debugging loop instead of treating them as separate tools.
- Its core move is to turn raw Python state into structured objects that the frontend can visualize without manual annotations.
- The project is strongest when it explains data structures and line-by-line behavior together, because the explanation stays tied to actual runtime values.
- The profiler adds a second layer of pedagogy by comparing observed behavior against theoretical complexity.
Most debuggers help you inspect a program. Glassbox tries to do something stranger: it explains the program back to you. That shift matters because the hard part of debugging is rarely finding a variable. It is understanding why the values on screen make sense.
The debugger that talks back
Glassbox sits in the gap between a stepping debugger and a teaching tool. It captures execution, renders state, and then adds a plain-English narration layer that points at actual values rather than vague abstractions. The result feels less like a log viewer and more like a runtime that can describe its own behavior.
That distinction is the whole article. Glassbox is not just showing what changed. It is trying to explain why the change happened, and it keeps that explanation anchored to concrete runtime facts.
The secret is in the trace
The backend starts with `sys.settrace`, which hooks into Python execution at the line level. Every step becomes a snapshot: source line, locals, and call context. That is the facts layer, and it matters because every later layer depends on those snapshots being precise.
def trace_calls(frame, event, arg):
    if event == "line":
        snapshot = {
            "line": frame.f_lineno,
            "locals": sanitize_locals(frame.f_locals),
            "function": frame.f_code.co_name,
        }
        frames.append(snapshot)
    return trace_calls
The harder part is that live Python objects are not naturally visualization-friendly. Glassbox sanitizes them into JSON-shaped data so the frontend can render them safely. That includes recursive structures, circular references, and custom objects that need to be flattened without losing the shape of the program.
This is where the project stops being a basic tracer. It is already making editorial decisions about what matters in a value. A list is not just a list. A linked node is not just an object. The renderer needs structure, not raw memory.
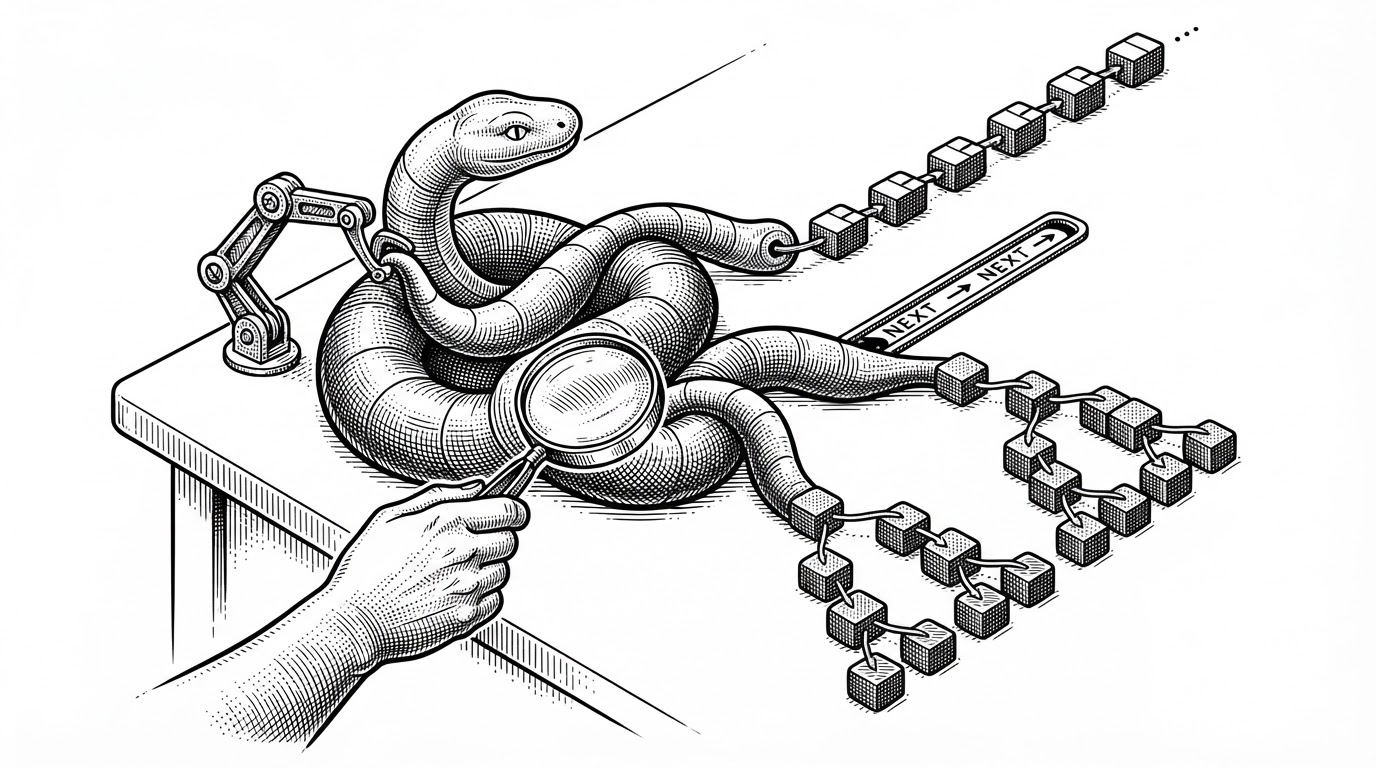
How Glassbox recognizes a linked list, not just an object
| What it sees | Traditional serialization | Glassbox |
|---|---|---|
| Primitives | Value text | Value text plus trace context |
| Custom objects | Flat object dump | Shape-aware object classification |
| Linked structures | Opaque references | Specialized list and tree routing |
| Recursive data | Often messy or truncated | Sanitized with cycle-aware handling |
The interesting trick is not only that Glassbox detects `next` or `left/right`. It is that those hints become a routing decision for the UI. Once the backend recognizes a shape, the frontend can swap in a visualizer that fits the object instead of forcing everything through one generic pane.
Why the AI layer matters, and where it should stay humble
The LLM layer is not the product’s brain. It is the narrator. It takes a frame and turns it into a step explanation that uses real variable values and concrete operations. That is useful for learners because it bridges the gap between code and intent without asking them to mentally simulate every line.
But the same layer can drift if it is left unconstrained. If the model starts inventing purpose, it stops debugging and starts storytelling. Glassbox’s value comes from keeping the narration tethered to structured trace data, so the explanation stays descriptive instead of imaginative.
That is also why the structured output matters. A readable explanation is not enough on its own. It has to map back to the current line, the highlighted values, and the object panes that prove the story is grounded in execution.
Big-O, meet the runtime
The profiler extends the same philosophy into complexity analysis. Instead of only telling you that an algorithm is quadratic or linear, Glassbox reruns the code at different input sizes, counts operations, and plots the observed curve. That turns complexity from a label into evidence.
| Question | Textbook answer | Glassbox answer |
|---|---|---|
| How fast is it? | O(n) or O(n²) | Measured across multiple input sizes |
| What caused the cost? | Hand-wavy explanation | Line-level operation counts |
| Can I trust the claim? | Only if the proof is clean | Compare the curve to the theory |
This is the sharpest pedagogical move in the repo. Students do not just read a complexity class. They see the curve produced by the code they actually ran, which makes the abstract notation harder to fake and easier to believe.
Where Glassbox sits among debuggers and visualizers
| Tool type | Strength | Blind spot |
|---|---|---|
| Traditional debugger | Exact execution control | Little explanation of intent |
| Static visualizer | Easy-to-follow teaching graphics | No real runtime state |
| LLM-only tutor | Natural language guidance | No proof that the code behaved that way |
| Glassbox | Trace, structure, explanation, and profiling together | More moving parts to keep reliable |
That last row is the point. Glassbox is unusual because it spans three categories at once. It traces execution like a debugger, renders data like a visualizer, and explains behavior like a tutor. Most tools do one of those well. Glassbox tries to make them reinforce each other.
The trade-offs hidden inside the magic
The costs are real. `sys.settrace` is powerful, but it is invasive. Sanitizing arbitrary Python objects is harder than it looks. LLM reasoning can be noisy, expensive, and occasionally overconfident. Every layer improves the experience, but every layer also adds a failure mode.
That is why Glassbox reads like a strong prototype rather than a settled platform. The architecture is compelling because it proves a thesis: debugging becomes much more teachable when facts, visuals, and narration are built as one system instead of bolted together afterward.