x64dbg-mcp-server: When a Debugger Becomes an MCP Tool
A native Zig plugin turns x64dbg into a live, event-aware API for agentic reverse engineering, with no Python wrapper and no runtime overhead.
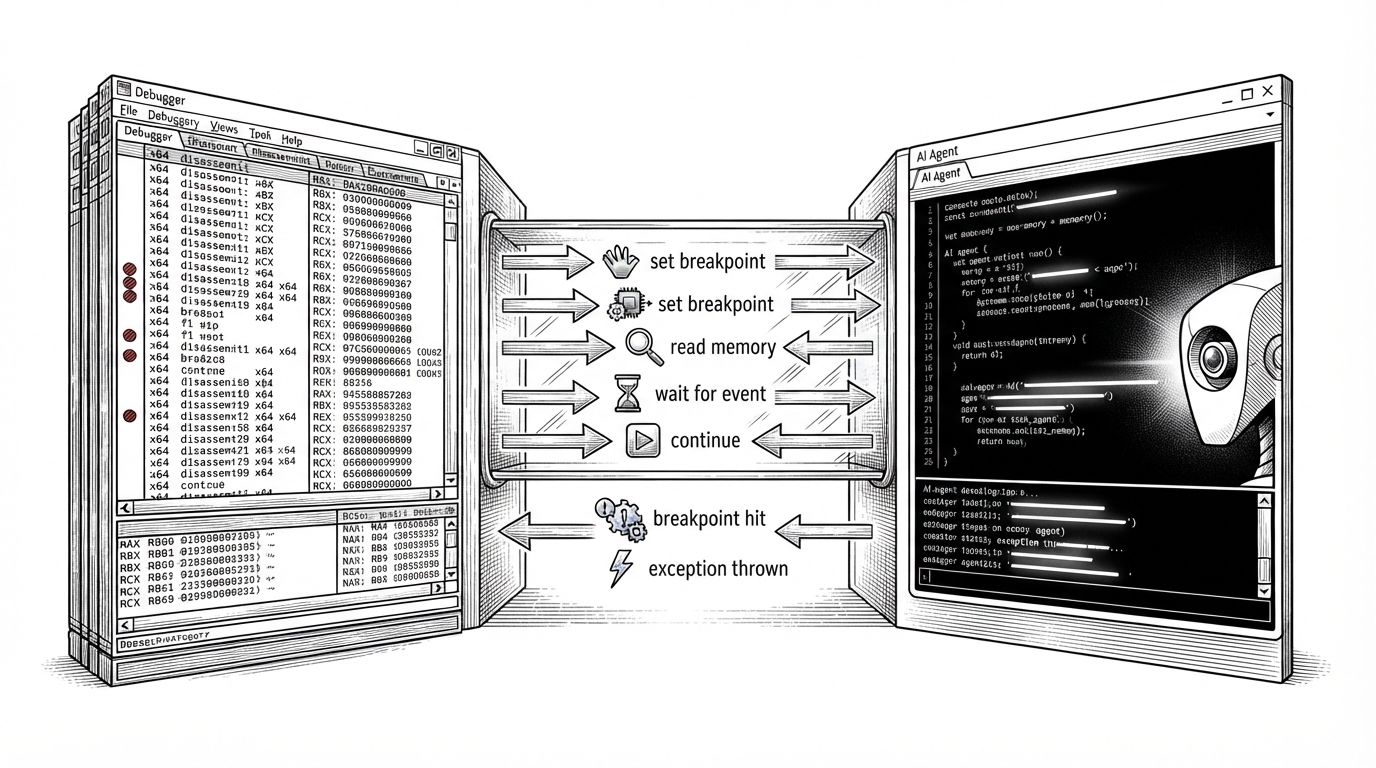

x64dbg-MCP Server is a native MCP (Model Context Protocol) plugin for x64dbg that exposes the debugger's full functionality over HTTP. Connect any MCP-compatible AI assistant and control x64dbg programmatically: set breakpoints, step through code, read memory, dump registers, and more.
- x64dbg-mcp-server matters because it turns a debugger into a protocol surface that an LLM can actually operate in real time.
- Its real breakthrough is not AI-assisted analysis, but the event bridge that reconciles asynchronous debugger state with synchronous tool calls.
- Zig is part of the product story here because it keeps the plugin native, compact, and free of extra runtimes.
- The project points to a broader shift where specialized developer tools become agent-native endpoints instead of scripts or screenshots.
The debugger that answers tool calls
The core idea is simple to state and unusual in practice. x64dbg-mcp-server lets an MCP-compatible agent talk to x64dbg as if the debugger were a living API, not a GUI that needs to be driven by hand. That means breakpoints, memory reads, register dumps, stepping, and event handling can sit inside one conversation loop.
That framing matters because reverse engineering is full of small, stateful decisions. A human can make them, but an agent can now assist without being reduced to a script runner. The project gives the model explicit tools, explicit schemas, and explicit feedback when the target changes underneath it.
Why agentic reverse engineering is different
Traditional RE is a sequence of manual judgments. You inspect a function, set a breakpoint, continue execution, notice a crash, inspect state again, then decide what to probe next. x64dbg-mcp-server keeps the human in the loop, but it lets the agent absorb the repetitive parts and respond to the next clue without losing context.
| Approach | Runtime model | Event handling | Best for |
|---|---|---|---|
| Manual debugger use | Human clicks and reads state directly | Implicit, in the operator’s head | Focused one-off analysis |
| Wrapper-based automation | External process controls x64dbg | Usually polling or scripted callbacks | Batch tasks and simple runs |
| x64dbg-mcp-server | Native plugin inside x64dbg | Push events plus blocking WaitForEvent | Conversational, event-aware RE |

How Zig makes the plugin feel native
The implementation choices are almost as important as the protocol idea. The project is written in Zig, builds without external runtime baggage, and targets both x86 and x86_64 from one build definition. That matters for a debugger plugin, where deployment friction is often the difference between a tool people try and a tool people keep.
// The project uses Zig's build system to emit native Windows targets.
const x32 = b.standardTargetOptions(.{ .default_target = .{ .cpu_arch = .x86, .os_tag = .windows } });
const x64 = b.standardTargetOptions(.{ .default_target = .{ .cpu_arch = .x86_64, .os_tag = .windows } });

// x64dbg APIs are resolved at runtime through the bridge layer.
const api = try bridge.resolveX64DbgApi();
try api.registerPlugin();
The bridge layer is also deliberately low-level. Instead of wrapping x64dbg with Python or leaning on a heavier runtime, the plugin binds to the debugger APIs directly and resolves symbols at runtime. That keeps it close to the metal, which is exactly what you want when the host process is itself the thing you are interrogating.
The real trick: turning debugger events into conversation
This is the part that makes the project feel more like a protocol machine than a clever wrapper. Debugger events arrive asynchronously, but an LLM interacts through sequential tool calls. x64dbg-mcp-server bridges that mismatch by combining a push path for events with a blocking wait path for the agent.
That design solves the hardest problem in agentic debugging: time. Debuggers are eventful, but LLM tool calls are usually request-response. The ring buffer absorbs the mismatch, SSE keeps the agent informed, and WaitForEvent gives the model a clean way to block until the next meaningful state change.
What the tool surface exposes
The tool registry is intentionally schema-first. Each ToolDef bundles metadata, a JSON schema, and a handler, which gives the agent a stable contract instead of a pile of ad hoc commands. The debug_only and read_only split is small but important, because it makes the surface safer to reason about.
const ToolDef = struct {
    name: []const u8,
    description: []const u8,
    schema: JsonSchema,
    handler: *const fn (ctx: *Context, args: JsonValue) anyerror!JsonValue,
    debug_only: bool,
    read_only: bool,
};

// Examples of high-level tools include memory inspection,
// breakpoint control, thread state, PE analysis, xrefs, and tracing.
For an LLM, that structure is the difference between guessing and acting. The model can infer intent from schema, but the plugin still constrains what the model can do at each step. That is a better fit for debugging than free-form scripting, where the edge cases are often the story.
Why this wins against wrapper-based alternatives
Earlier bridges tend to sit outside the debugger and translate between worlds. That can work, but it usually adds latency, more deployment pieces, and more failure modes. x64dbg-mcp-server keeps the control plane in-process, which is cleaner for responsiveness and simpler for users who just want to drop in a plugin and start analyzing.
| Project | Runtime model | Deployment complexity | Event handling | Tooling surface | Best for |
|---|---|---|---|---|---|
| x64dbg-mcp-server | Native Zig plugin inside x64dbg | Low | SSE plus WaitForEvent with buffered state | Schema-driven MCP tools | Live agentic RE |
| wasdubya/x64dbgmcp | C++ plugin plus Python server | Higher | More wrapper-dependent | Bridge-style commands | Early proof of concept |
| AgentSmithers/x64DbgMCPServer | .NET Framework server | Moderate | HTTP-oriented | Debugger exposure over HTTP | Quick integration |
| lisa.py | LLDB-focused Python tooling | Moderate | Script-driven | Debugger automation | LLDB workflows |
The trade-off is clear. Wrapper-heavy systems are often easier to prototype, but they are less native to the debugger’s own timing and state model. This project optimizes for fidelity first, then protocol convenience.
What this says about the future of debugging
The broader shift is larger than x64dbg. Specialized tools are becoming protocol surfaces, which means agents can act on them directly instead of inferring state from screenshots, logs, or copied text. Once a debugger becomes an MCP endpoint, the conversation is no longer about whether AI can help. It is about how cleanly the tool exposes its own reality.
That is why x64dbg-mcp-server is interesting even if you never use it on malware. It shows how a dense, stateful desktop tool can be made legible to an agent without flattening what makes the tool powerful in the first place.