fruitcake/laravel-debugbar: The Laravel Profiler That Has to Vanish Into Your Page
A deep look at the package that injects itself into HTML, tracks queries and requests, and survives modern Laravel patterns like Livewire and Octane without letting one request contaminate the next.
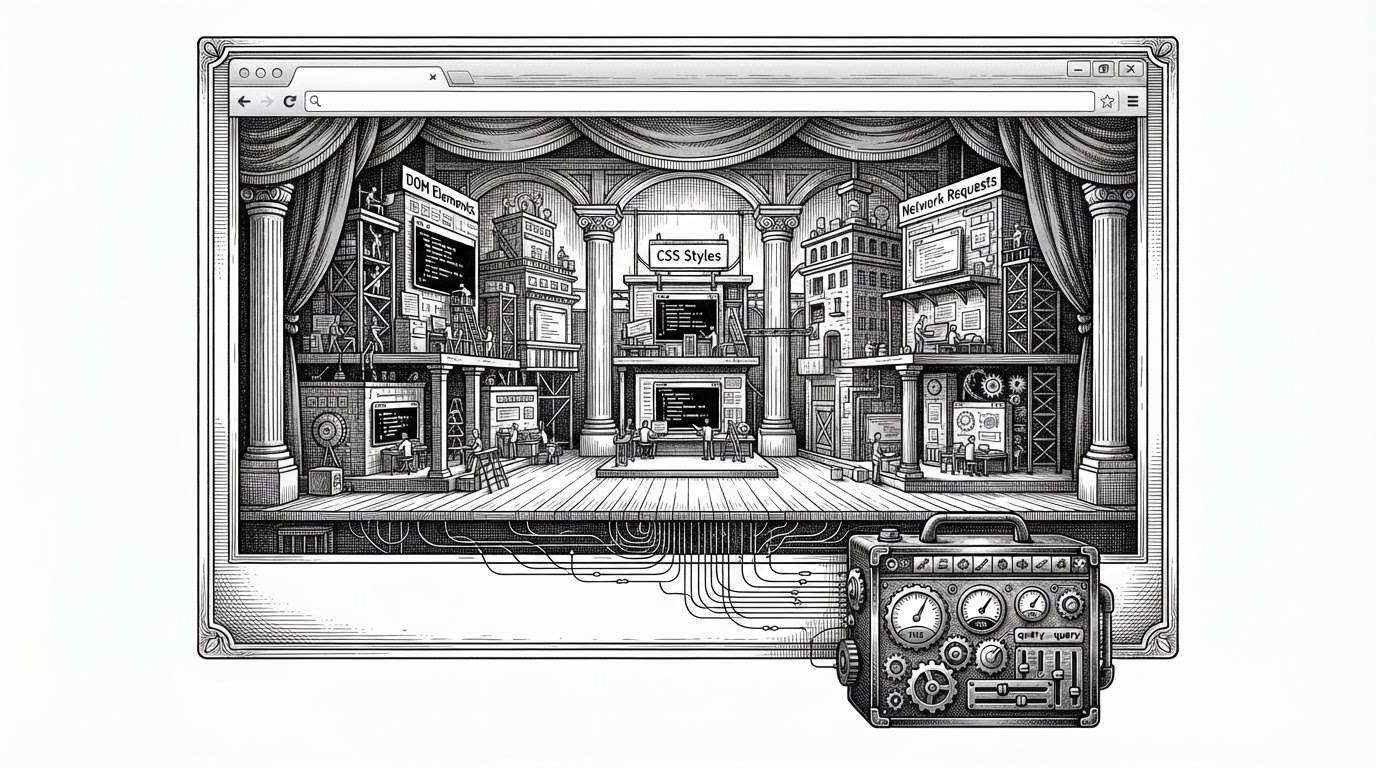
- Debugbar’s core trick is paradoxical: it observes a Laravel response by joining that response at the last possible moment.
- Modern Laravel made the package harder to build, not easier, because Livewire and Octane demand request isolation across repeated and long-lived flows.
- The package’s real engineering cost sits in bounded collection, especially query profiling, where deep inspection can become a memory problem.
- Debugbar still wins when you want immediate, in-page feedback for traditional server-rendered Laravel apps.
The profiler that edits the page it is measuring
The neat trick in fruitcake/laravel-debugbar is also its hardest constraint: it has to study a request by modifying that request’s response. That means it cannot behave like a passive logger. It has to collect data, wait for the HTML to finish, then inject a toolbar without changing what the app means or how the page renders.
That sounds simple until you remember what it is watching. Queries, memory, views, events, and sometimes nested interactions like Livewire are all moving at once. The package has to stay useful, stay quiet, and stay out of the way.
Why old PHP assumptions no longer hold
Classic Laravel debugging assumed one request, one response, one process, and then a clean exit. That model still matters, but it is no longer the whole story. Livewire adds sub-requests. JSON endpoints need profiling without HTML injection. Octane keeps workers alive, which means state can leak if the package forgets to reset itself.
That is why the modern job is not just collecting data. It is preserving boundaries. Every request needs to look like the first one, even when the process behind it is anything but new.
The orchestration layer: ServiceProvider, LaravelDebugbar, and drivers
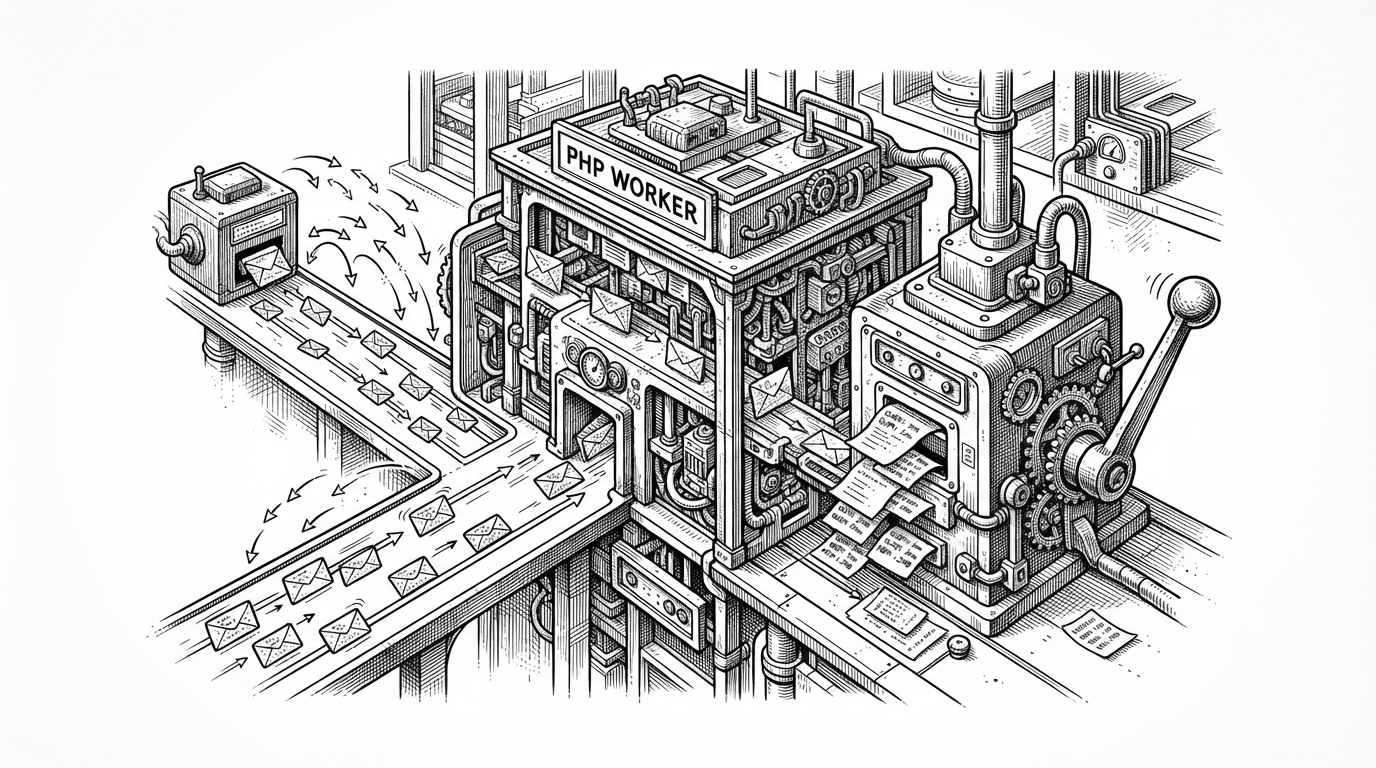
The architecture is tidy on purpose. The ServiceProvider listens for framework lifecycle events and hands the finished request to the central debugger. LaravelDebugbar acts as the manager, assembling collectors, assigning request IDs, and deciding when the bar is active.
Below that sits the HTTP driver. It translates Debug Bar’s generic expectations into Laravel’s cookie and response system, which is how the package keeps state attached to the right request and still survives JSON responses that never render HTML.
<?php

// Simplified flow
$debugbar = app('debugbar');
$debugbar->addCollector($queryCollector);

app()->terminating(function () use ($debugbar) {
    $debugbar->handleResponse();
});
Barry vd. Heuvel described the package’s origin as a practical extension choice, not a blank-sheet invention: “I found PHP Debug Bar which already contained some Symfony-minded collectors, so it was pretty easy to just extend it and created Laravel Debugbar.” Interview with Barry vd. Heuvel
The QueryCollector is where the real cost lives
Most people install Debugbar for one reason: query visibility. That is also where the package has to be the most careful. A collector that listens to every QueryExecuted event is useful. A collector that keeps stacking expensive backtraces on every query becomes a liability.
So the package uses bounds. It can stop collecting deep source data once the page gets noisy, which keeps profiling from turning into a memory bomb. That trade-off is the difference between a diagnostic tool and a self-inflicted slowdown.
| Mode | What it captures | Risk | Best use |
|---|---|---|---|
| Full profiling | Queries plus source location plus rich context | High memory and CPU overhead | Small pages, targeted debugging |
| Bounded profiling | Queries with limited deep tracing | Less detail on very noisy pages | Everyday development |
| No profiling | Nothing extra | Lowest overhead | Production safety and baseline testing |
The feature is most valuable when it helps you explain a bad page fast. The package’s engineering discipline is what keeps that power from spiraling into something you can’t leave enabled for a single second longer than necessary.
How it compares to Telescope, Clockwork, and Ray
Debugbar is not the only answer to Laravel debugging. It is the answer for a very specific shape of work: server-rendered pages where the fastest feedback loop is the browser itself.
| Tool | Operating model | Best at | Trade-off |
|---|---|---|---|
| Debugbar | In-page toolbar injected into HTML | Immediate feedback on Blade and SSR apps | Can’t be the default for every response type |
| Telescope | Standalone dashboard backed by storage | Historical inspection across requests, jobs, and mail | More setup and more persistence overhead |
| Clockwork | Browser extension and request inspector | APIs, SPAs, and non-intrusive profiling | Less native in-page visibility |
| Ray | Separate desktop app for direct output | Cross-context debugging from app, CLI, or remote servers | Outside the browser and usually a paid workflow |
Barry vd. Heuvel frames the difference plainly: “Debugbar is both the toolbar and the detailed info, Telescope Toolbar is just the toolbar and leverages Telescope for the rest.” Debugbar vs Telescope Toolbar
The real risk: a dev tool that can become a leak
The package is powerful because it can expose a lot. SQL, session data, logs, env-adjacent information, and route behavior are exactly the kinds of details you want in development and absolutely do not want in production.
That makes the guardrails part of the product, not a footnote. A good profiler is not just accurate. It is hard to leave on by accident, and hard to confuse with a harmless browser widget.
| Question | Safe answer | Dangerous answer |
|---|---|---|
| Should it be on in production? | No | Yes |
| Should it reveal internal query detail? | Only in trusted development contexts | Publicly |
| Should it keep state across requests? | No, it must reset cleanly | Yes, and hope for the best |
That is the recurring tension in the whole project. The more faithfully it reflects what your app is doing, the more careful it must be about who can see that reflection.
What this project says about Laravel itself
Debugbar tracks the framework’s evolution almost by accident. It began as a tool for a simpler request model, then had to adapt as Laravel became richer, more interactive, and more stateful under the hood.
That is why the project still matters. It is not only a profiler. It is a record of how Laravel changed, and a reminder that debugging tools age alongside the systems they inspect.