observe: the open-source observability stack that measures AI margin, not just tokens
It turns model calls, Stripe revenue, and cached responses into one question: which customers and features actually pay for themselves?

- observe reframes AI monitoring around gross margin, so the most important output is a profitability signal instead of a token chart.
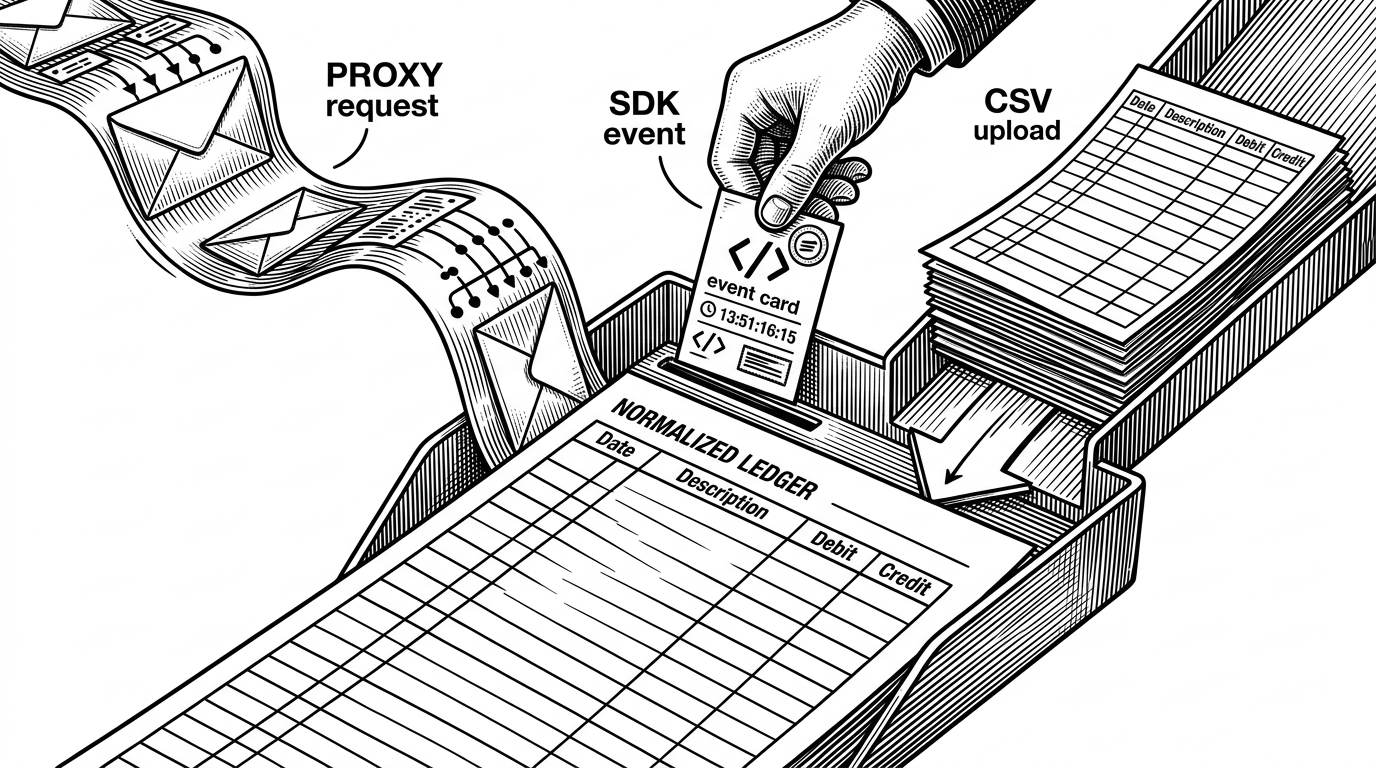
- The platform can absorb proxy traffic, SDK events, and CSV backfills into one normalized ledger, which makes late-stage finance analysis possible.
- Its product surface includes pricing, caching, billing, and feature gates, so it behaves like a control plane for an AI SaaS business.
- The repo reads like a cohesive system built by a small, fast-moving team rather than a thin dashboard wrapper.
The dashboard that asks if your AI feature is profitable
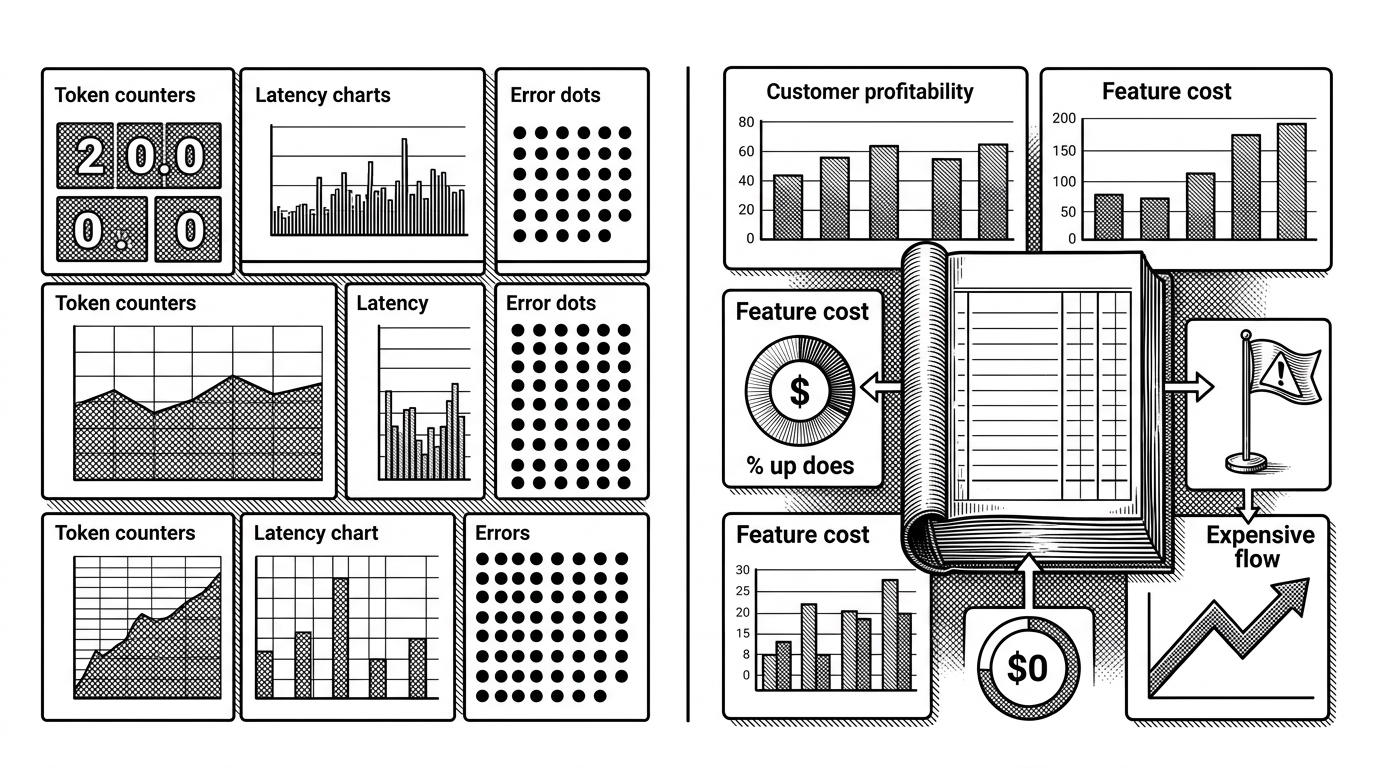
Most AI observability tools stop at tokens, latency, and errors. observe asks a harsher question: did this trace earn more than it cost? That shift matters for SaaS teams that now treat model calls as a line item, not a novelty.
The project’s core move is simple and unusual. It puts usage, model pricing, cache behavior, and revenue data into the same frame, so a product team can see customer profitability, margin-compressing features, and expensive flows instead of just raw traffic.
What observe measures that other tools miss
This is not just LLM monitoring with a billing tab bolted on. The codebase is built around revenue-aware analysis, which means the dashboard can answer questions that ordinary trace tools leave open: which customers are unprofitable, which features burn margin, and which requests only look healthy until you attach revenue to them.
| Product type | Primary question | Data sources | What it misses |
|---|---|---|---|
| observe | Which traces and customers make money? | Proxy, SDK, CSV, pricing, Stripe | Nothing in the billing loop |
| Token observability tool | What did the model call cost? | LLM traces, latency, tokens | Revenue, customer margin, pricing context |
| Generic observability stack | Is the system healthy? | Logs, metrics, traces | Business outcome and unit economics |
| Warehouse + BI | How profitable is the feature? | Billing exports, logs, warehouse tables | Slow setup and no live trace context |
How usage becomes a margin number
The mechanics are more interesting than the headline. In server/routes/proxy.ts, the proxy layer catches model traffic and can attach metadata before the request moves on. In packages/sdk, teams can instrument events manually when they want more control than a transparent proxy gives them.
From there, server/model-pricing.ts assigns cost, including override support for negotiated rates, while cache accounting tracks the savings from repeat calls. The final join happens when revenue data enters the same model, so the system can compute gross margin per trace instead of stopping at spend.
Why the product feels like a SaaS control plane
The repo does not read like a telemetry toy. server/billing.ts includes feature access logic, usage limits, and bonus credit mechanics, which means the product is thinking about customer lifecycle and monetization as part of the core system, not as an afterthought.
That makes sense for the category. If the point is to help teams decide whether an AI feature pays for itself, then billing, access control, sample data, and onboarding all belong in the same product surface. The whole stack starts to look less like an observability tool and more like a control plane for an AI SaaS business.
Where it sits in the landscape
Compared with token observability tools, observe is answering a different question. Compared with generic observability platforms, it is narrowing the field to the economics of AI features. Compared with a warehouse plus BI stack, it gets to the answer faster because the trace, the cost, and the revenue can meet before they disappear into separate systems.
That is the real differentiator. The project is not trying to become the broadest telemetry platform. It is trying to make the profit math legible while the product is still running.
What the codebase says about the team
The structure is unusually coherent for a broad project. A TypeScript-heavy backend, a Vue frontend, a dedicated SDK, and an orchestration package all point in the same direction: one team is building the data path, the UI, and the business rules together instead of stitching them in after the fact.
The commit pattern suggests a small, fast-moving core with occasional assisted contributions, which often produces the kind of sharp product opinion this repo has. That shows up in the details. Sample data is built to teach the product, not just fill an empty screen. Pricing is flexible enough for enterprise overrides. Feature access is part of the monetization story. The result is a repo that feels complete because the business logic is part of the architecture.