figma-chart-skill: The Markdown Skill That Makes Claude Build Figma Charts
It reads a template, infers design intent, detaches the right components, and fills charts and tables without turning Figma into a hand-built plugin project.
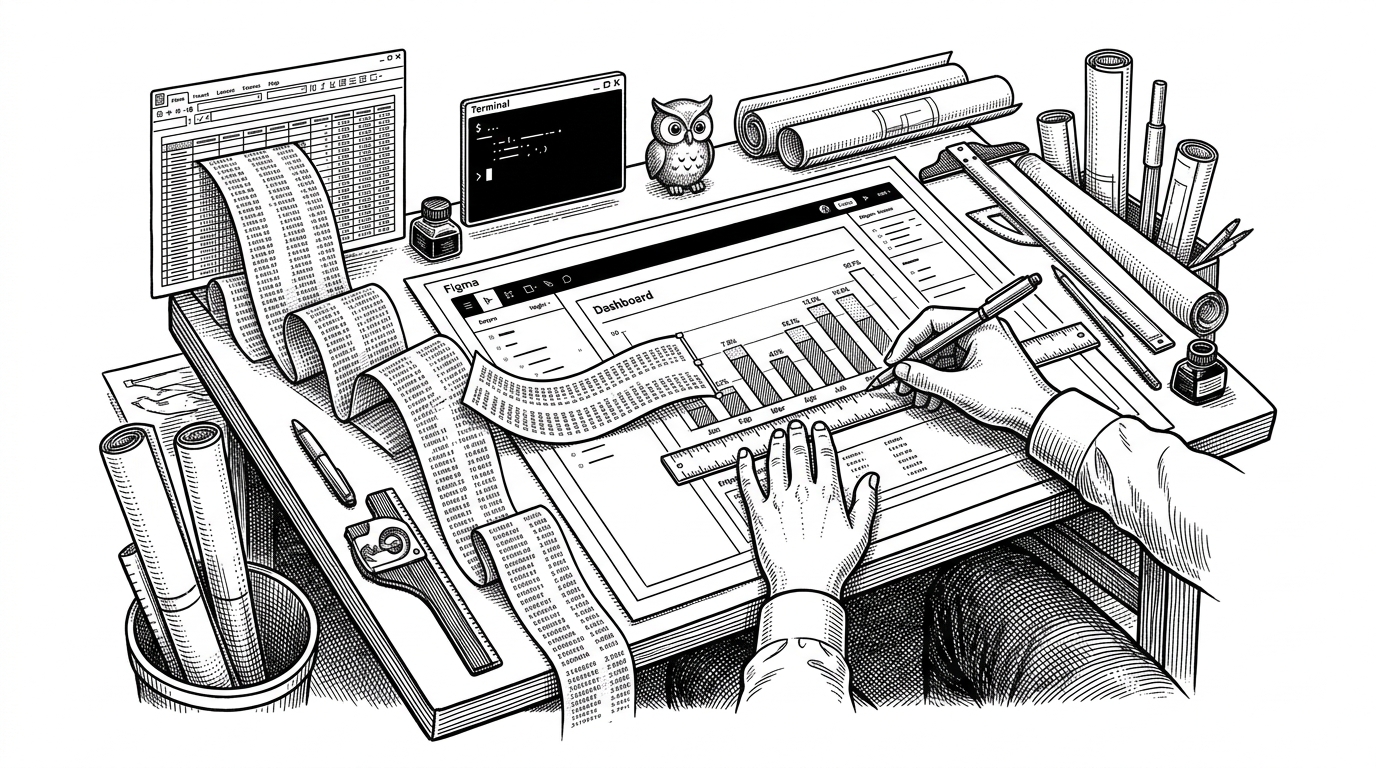
- figma-chart-skill treats Markdown as executable design logic, with Claude Code acting like the runtime.
- Its real trick is template-first editing, which preserves the visual rules already living in the Figma file.
- Bar charts and tables become the same problem once style, structure, and data mapping are separated cleanly.
- The repo points to a broader shift in agent tooling, where the model operates inside constraints instead of replacing them.
Most Figma automation starts with a blank script and ends with cleanup. figma-chart-skill flips that sequence. The skill is written as Markdown for Claude Code, so the model reads a template, learns the design rules already present, and then fills data into the existing system instead of redrawing it from scratch.
The code is the prompt
That is the first surprise. The repository does not behave like a conventional app with a UI, a framework, and a pile of event handlers. It behaves like an instruction set, where the skill file describes the workflow and Claude Code executes it against Figma through MCP.
In practice, that makes the project feel less like a plugin and more like a tiny compiler for design work. You give it structured data, an existing Figma template, and a set of style constraints. It returns a chart or table that still looks like it belongs in the file you started with.
Why Figma charting is still annoying
The pain is not making a chart. The pain is making a chart that still matches the design system after the data changes. Copying rows from a spreadsheet into Figma is tedious, and every small design tweak usually means another round of manual cleanup.
That is why so many workflows break down in the last mile. The chart is correct, but the spacing is off. The numbers are right, but the type scale drifts. The table has the right content, but the borders, fills, and row heights no longer match the template.
| Workflow | Setup cost | Style preservation | Repeatability | Best for |
|---|---|---|---|---|
| Manual copy-paste in Figma | Low at first, high over time | Weak | Poor | One-off edits |
| Traditional Figma plugin | Higher, because you build the plugin path | Mixed, unless you code for the template | Good if maintained | Teams with plugin engineering capacity |
| figma-chart-skill | Low, because the workflow lives in Markdown | Strong, because it reads the template first | Strong | Data updates inside an existing design system |
The trick is reading the template before changing it
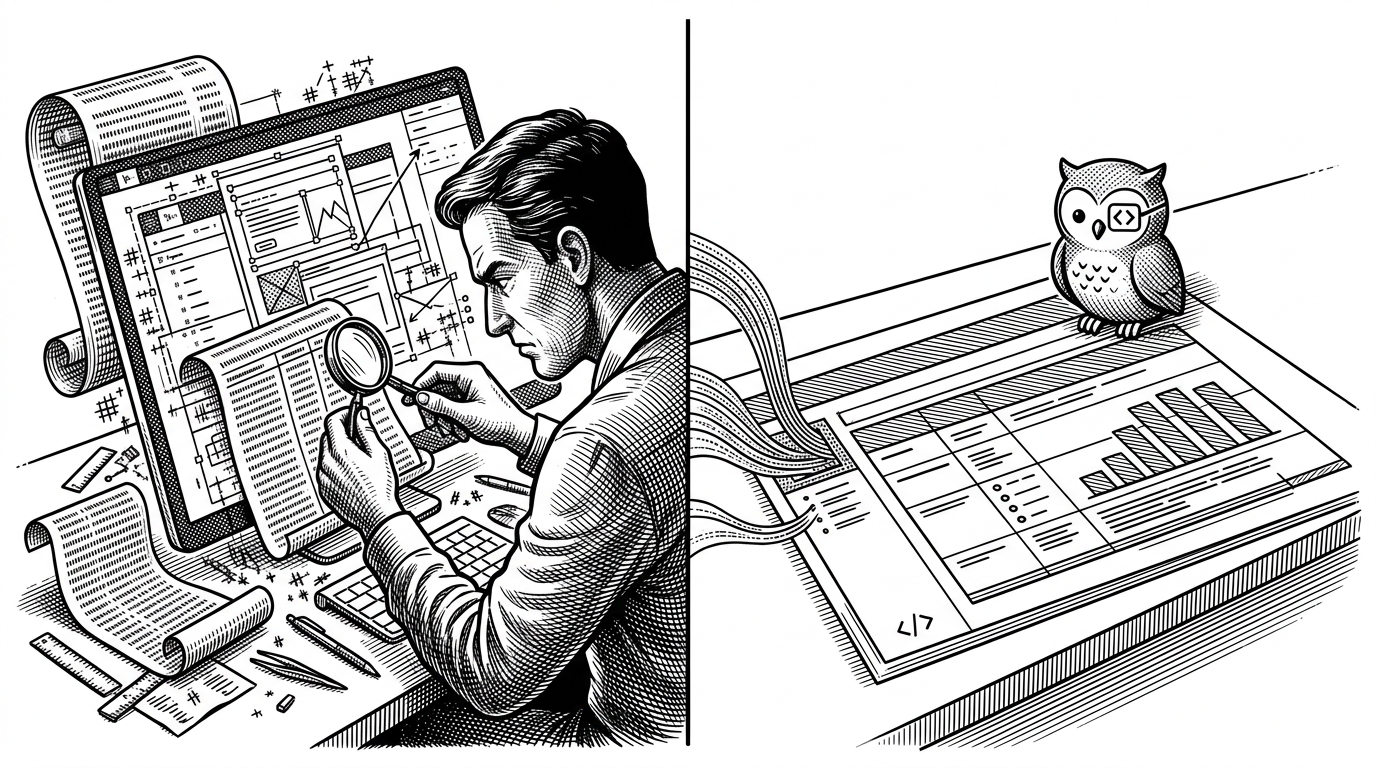
This is where the repo stops being a convenience layer and becomes a design system operator. The skill looks at the current table or chart, samples the style properties already in the file, and treats those values as the rules for whatever it generates next. That means fonts, fills, strokes, spacing, and sizing are inherited from the template instead of guessed.
1. Read the existing Figma template
2. Sample the current style properties
3. Detach the instances that must change
4. Map incoming values to the correct nodes
5. Apply output rules without breaking the template

newGraphHeight = (value / guideMax) * maxBarArea + labelArea

The point of the formula is not just placement. It is placement inside the same visual grammar the template already established.
That template-first approach matters even more when the data includes edge cases. The repository explicitly handles negative notation, including the `▲` marker common in Japanese financial reporting, which is a good sign that the skill is meant for real business material rather than toy demos.
Bar charts and tables are two versions of the same problem
Once you strip away the visual surface, the chart and the table become cousins. Both are structured data laid out in repeated units. Both depend on style rules that must stay consistent across many nodes. Both get messy the moment a human has to reapply those rules by hand.
| Surface | What must stay fixed | What changes | Why the skill helps |
|---|---|---|---|
| Bar chart | Axis logic, spacing, label style, bar container structure | Heights, values, labels | It maps numbers into existing geometry without rebuilding the chart |
| Table | Typography, borders, fill logic, row rhythm | Cell values, row count, occasional emphasis states | It extends the layout while preserving the design intent of the template |
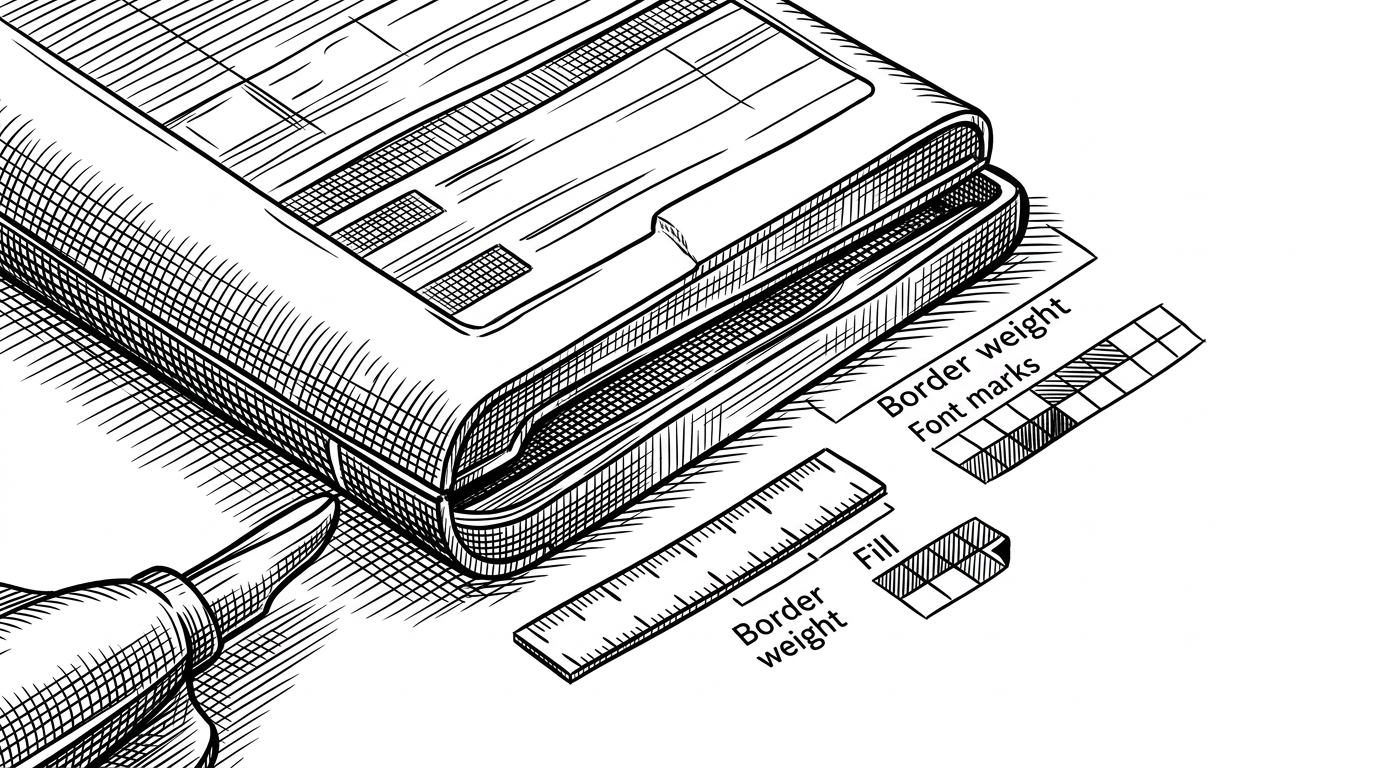
That is why the repository is more interesting than a narrow chart helper. It is not teaching Claude how to draw one shape. It is teaching Claude how to operate inside a repeatable layout system and change only the parts the data should own.
What this says about Claude Code and MCP
The repo is a useful signal for where agent tooling goes next. The model is not being asked to invent the design system, or to improvise a UI from scratch. It is being asked to work inside a constrained environment, follow a documented workflow, and preserve structure while mutating content.
That is a promising pattern, but it is still a narrow one. It works best when the task is repetitive, style-sensitive, and already anchored to a template. In that zone, Markdown becomes a control surface, MCP becomes the transport, and Claude Code becomes the operator.