workflow-throttle: Rate Limiting That You Can Watch Think
A durable token bucket turns a familiar backend pattern into a replayable workflow, then streams every decision into a live code workbench.
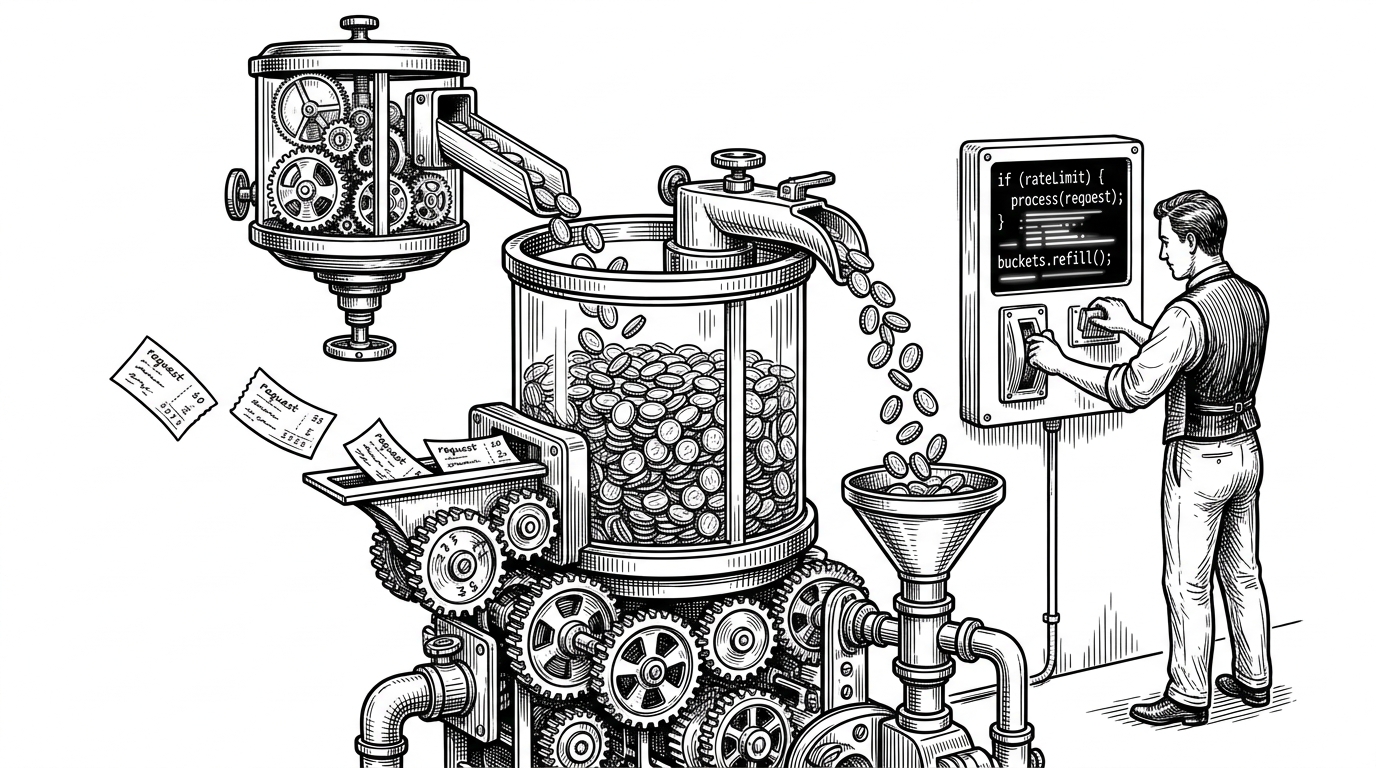
- workflow-throttle turns rate limiting into a durable process that can be replayed, inspected, and resumed instead of silently discarded when a request path ends.
- Its real novelty is not the token bucket algorithm itself, but the way runtime decisions stay linked to source code and a live event stream.
- The frontend acts less like a dashboard and more like a debugger, because it maps workflow events back to exact lines in the throttling logic.
- This makes the pattern valuable when throttling is part of a larger stateful workflow, not when you only need the cheapest possible counter.
Traditional rate limiting is designed to disappear. A request comes in, a counter changes somewhere, and the caller gets a yes or no. workflow-throttle pushes against that instinct. It treats throttling as a workflow with memory, replay, and telemetry, so the decision is something you can observe while it is happening.
The rate limiter that explains itself
In the analyzed code, the heart of the system is a durable token bucket implemented as a workflow. Requests are checked one by one, tokens are decremented when available, and refills happen on a defined cadence. Because the logic runs inside workflow primitives, the state is not just local process memory. It becomes part of the execution record.
That changes the mental model. A conventional limiter answers the question, "Can this request proceed?" This one answers a more useful question for debugging and auditing: "What happened, in what order, and why did the state change the way it did?"
Why a workflow, not middleware
The architectural move is straightforward once you see it. Standard middleware rate limiting usually relies on in-memory state, Redis, or another external store. That works well for simple quotas, but it separates the logic from the runtime story. workflow-throttle keeps the control flow, the state, and the audit trail in one place.
| Approach | Where state lives | Survives restart | Auditability | Best fit |
|---|---|---|---|---|
| In-memory middleware | Process memory | No | Low | Simple request caps |
| Redis-backed counters | External store | Yes | Medium | Shared quotas and fixed windows |
| Workflow throttle | Durable workflow state | Yes | High | Inspectable multi-step throttling |
That tradeoff matters. A workflow adds conceptual weight, but it buys you replayability and legibility. If throttling is part of a larger process, the ability to inspect each decision can matter more than shaving a few lines off the implementation.
Inside throttleFlow
The implementation centers on a loop that evaluates requests, updates a local token count, and emits structured events along the way. A step boundary wraps the request evaluation so the workflow engine can retry the unit of work without re-running the whole sequence. That is the difference between code that merely runs and code that can be resumed with confidence.
export async function throttleFlow(requests: number[], refillRate: number) {
  "use workflow";

  let tokens = refillRate;
  let accepted = 0;
  let rejected = 0;

  for (const request of requests) {
    "use step";

    if (tokens > 0) {
      tokens -= 1;
      accepted += 1;
    } else {
      rejected += 1;
    }

    if ((accepted + rejected) % refillRate === 0) {
      tokens += refillRate;
    }
  }

  return { accepted, rejected, tokens };
}
The important part is not the specific token math. It is the fact that the workflow engine can persist progress across the loop, then resume with the same state and the same decision history. That is why the demo can feel closer to a long-lived process than a one-shot API handler.
The frontend is a debugger
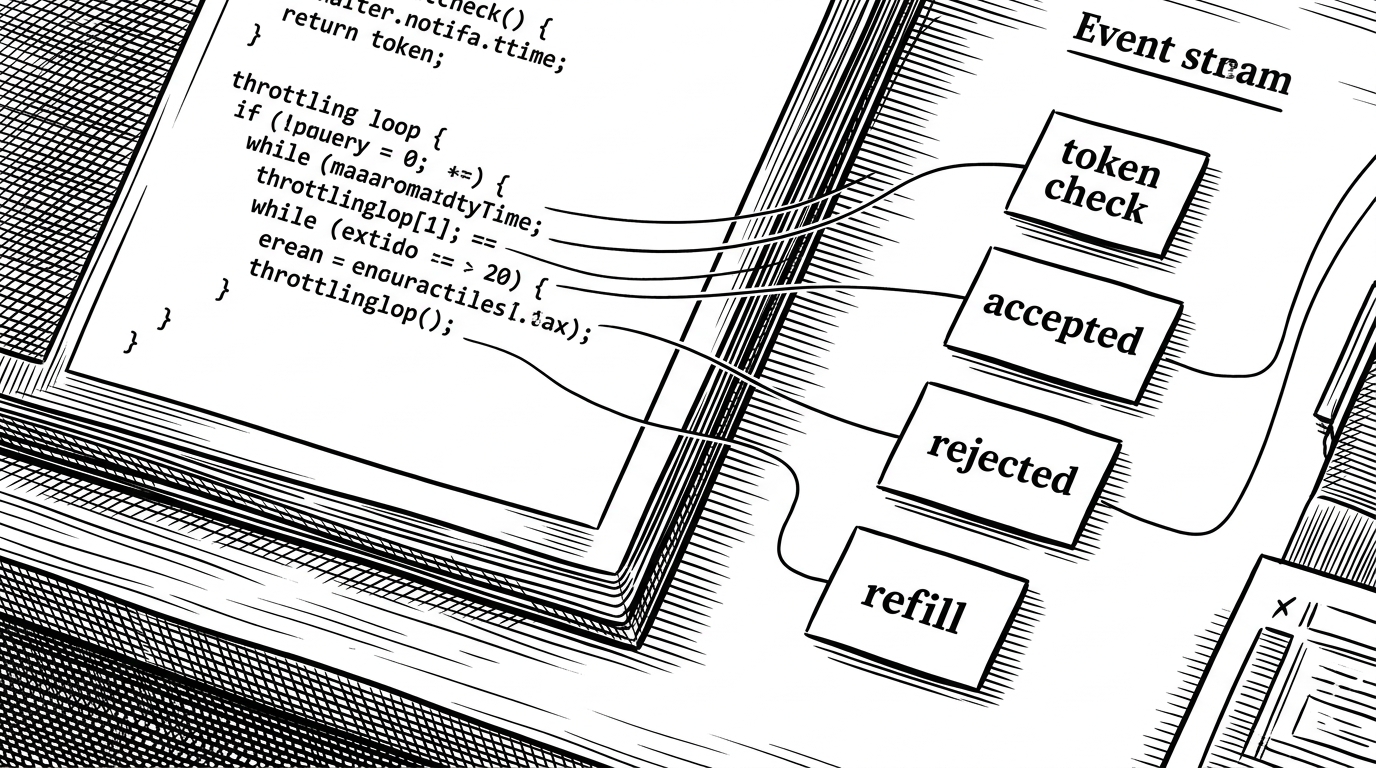
This is where the repo becomes more than a durable execution demo. The frontend reads the workflow source, builds a line map, streams execution events through SSE, and highlights the matching code as those events arrive. The result is a workbench that teaches the system by showing it in motion.
That pattern is stronger than a dashboard because it ties observation back to the implementation. You do not just see that a request was rejected. You see where that rejection came from in the code, and you can follow the state transition as a first-class object.
How the bridge works
The route that starts the workflow returns a run identifier. A readable route then exposes the workflow stream as server-sent events. On the client, the event stream is mapped to code regions, so token checks, acceptances, rejections, and refills can light up different lines inside the workbench.
// Conceptual flow
start(throttleFlow, requests) -> runId
run.getReadable() -> SSE stream
SSE event -> line map lookup -> highlighted code region
What it buys you, and what it costs
workflow-throttle is not the cheapest way to limit traffic, and it is not trying to be. Its value shows up when throttling is part of a larger stateful sequence, especially one you want to inspect, replay, or explain to someone else after the fact.
| Question | Conventional limiter | workflow-throttle |
|---|---|---|
| Can I see the decision path? | Usually not | Yes, as a live event stream |
| Can I resume after interruption? | Sometimes, with external storage | Yes, as durable workflow state |
| Can the UI explain the backend? | Rarely | Yes, through source-linked highlighting |
| Is it simplest for raw throughput? | Often yes | No |
The broader pattern is bigger than throttling. It is about code that ships with its own explanation. The backend state is not hidden behind a log dump, and the UI is not a disconnected facade. They are two views of the same process.