FinRisk and the 70 Features That Aren't There
A solo notebook project trained on 1.3 million Lending Club loans gets the hardest part of credit modeling right. The interesting question is how you can tell.

- FinRisk's 70-feature set excludes every post-origination payment field, which is the difference between a credit model that works and one that has memorized the answer.
- Persisting the feature-name list as its own artifact turns the inference contract into something you can check rather than something you assume.
- Pairing signed logistic coefficients with XGBoost SHAP values gives a credit reviewer direction and a modeler magnitude from the same pipeline.
- The committed corrupted backup and recovered notebook sitting side by side are the clearest evidence of what notebook-as-pipeline costs.
The 99% Model That Gets Everything Wrong
Build a credit-default model on Lending Club data and you will eventually notice that it is working suspiciously well. Accuracy north of 98%. Clean confusion matrix. Then you look at the feature list and find total_pymnt sitting in it, and the floor drops out.
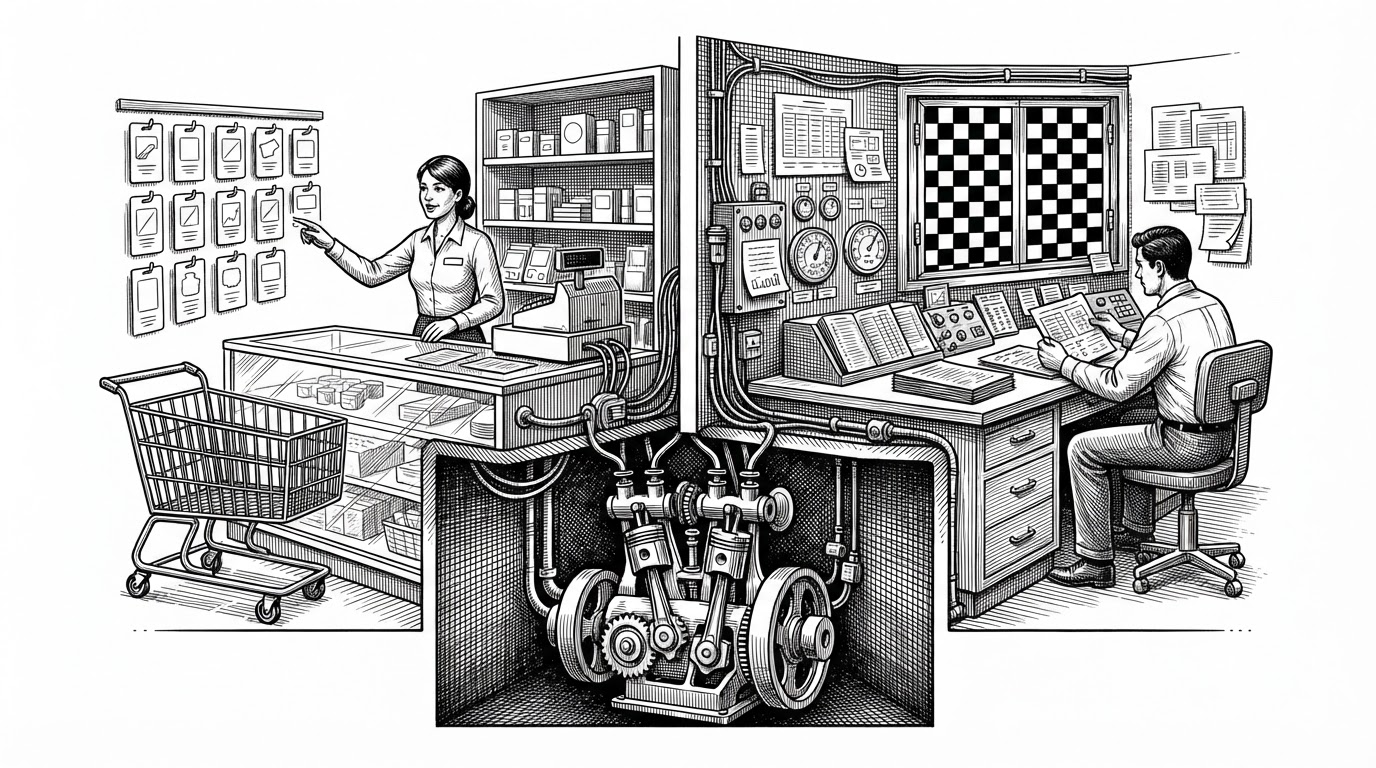
Lending Club's public loan file is not a snapshot of applicants. It is a snapshot of completed loans, and it carries the whole life of each loan inside it. total_pymnt is the sum of every payment the borrower ever made. total_rec_prncp is the principal already recovered. last_pymnt_amnt is the most recent payment. recoveries is what collections clawed back after a charge-off.
Each of those columns is a partial restatement of the target. A loan that ended in default did not make its full scheduled payments, and the payment columns know that. Feed them to a classifier and it does not learn credit risk. It learns to read the answer key off the question sheet.
# What leakage looks like in a Lending Club feature list
LEAKED = [
    "total_pymnt",        # sum of payments already received
    "total_rec_prncp",    # principal already recovered
    "last_pymnt_amnt",    # most recent payment
    "recoveries",         # post-charge-off collections
]

# FinRisk's 70-feature list contains none of these.
This is the most common failure mode in consumer credit machine learning, and it is invisible in the metrics. A leaked model looks like a triumph. It is usually reported as one.
Which is why the right response to any credit model is a question, not a score: what did you leave out, and why?
Eight Notebooks, One Pipeline
FinRisk is a solo project by the GitHub user ankitabehera777. It has one contributor, zero stars, and no license. It is not a library, a framework, or a product. It is eight Jupyter notebooks arranged in a line, plus the artifacts they produce.
- 2.26 million rows in the raw
loan.csv - 1,303,638 rows in the modeled dataset
- 73 columns reduced to 70 before training
- 79.93% non-default, 20.07% default, preserved exactly across an 80/20 stratified split
The notebooks run in a documented order: connect to the data, explore it, clean and engineer features, train, evaluate, test the saved model. Nothing is packaged. There is no src/ directory, no importable module, no test suite, even though pytest appears in the README's stack.
Two directories that every notebook depends on are missing from the repository tree: data/raw/ and models/. Both are almost certainly gitignored, which means a fresh clone cannot run the pipeline without the author's local files. That is worth holding onto. It is not a footnote about this repo. It is the default state of a great deal of real machine learning work.
The Feature Contract
The training notebook loads three artifacts, not one.
MODEL_PATH        = "../models/finrisk_xgboost_model.pkl"
PREPROCESSOR_PATH = "../models/finrisk_preprocessor.pkl"
FEATURES_PATH     = "../models/finrisk_feature_names.pkl"

model         = joblib.load(MODEL_PATH)
preprocessor  = joblib.load(PREPROCESSOR_PATH)
feature_names = joblib.load(FEATURES_PATH)
Saving the model and its preprocessing pipeline together is standard practice. Saving the feature names as a third artifact is the small, deliberate choice that matters. A serialized scikit-learn pipeline will happily accept a DataFrame whose columns have been reordered, because it trusts positional order. If the columns shift between training and inference, the model does not raise an error. It produces confident nonsense.
Keeping the feature list on disk turns that silent failure into a checkable one. It is the kind of detail that separates a notebook that ran once from a pipeline someone could actually operate.
The evaluation notebook goes further and asserts its assumptions out loud. It verifies that the empty-column check returns an empty list, that the categorical column count is zero, and that train and test class proportions match to two decimal places. These are the sanity checks most notebook projects skip, and their presence is a stronger quality signal than any accuracy number would be.
Where the Answer Lives
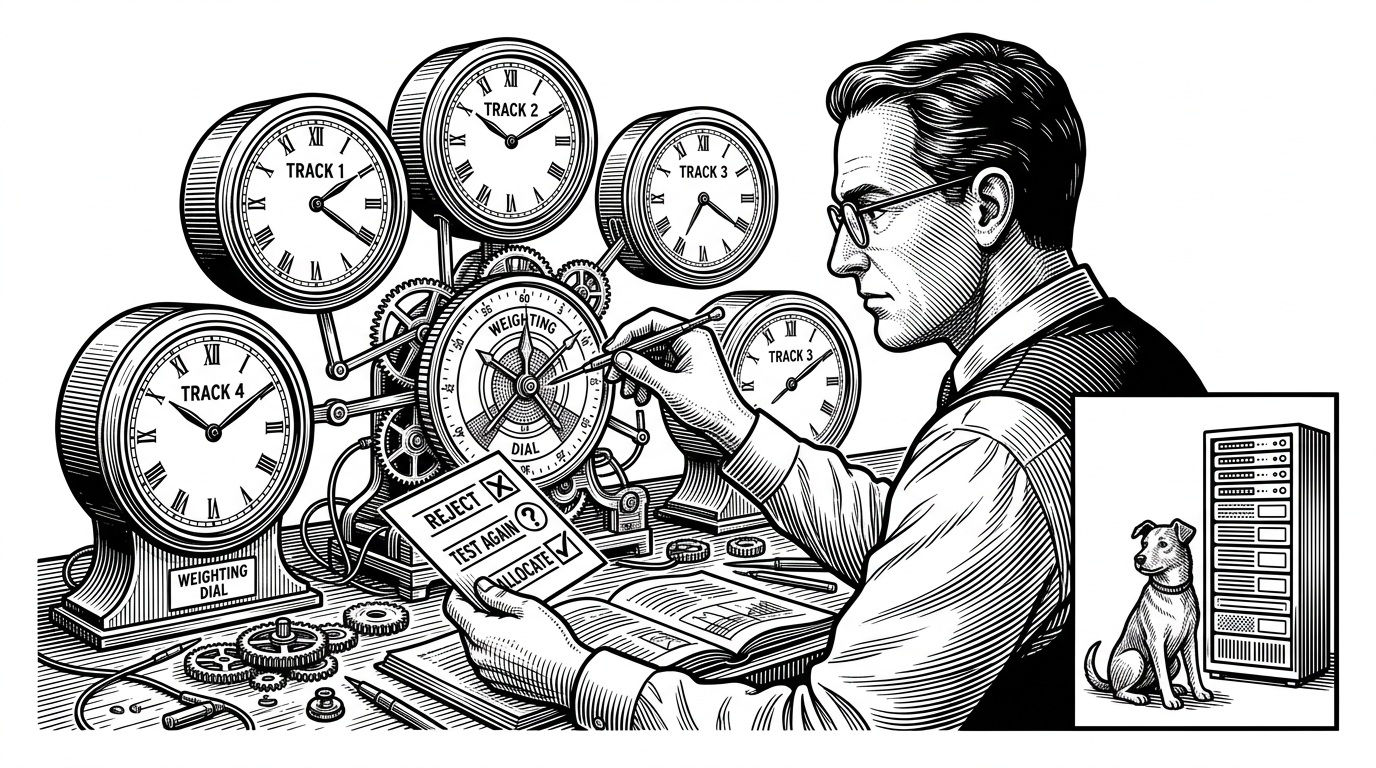
The rule that FinRisk appears to have followed is simple to state and easy to violate: every feature has a timestamp, and so does the target. A feature is safe only if the thing it describes happened before the thing you are predicting.
For a consumer loan, that line falls at origination.
Above the line sit the things a lender knows when it decides: income, debt-to-income ratio, employment length, and the grade and interest rate the lender assigns during underwriting. Below the line sit the things that only exist because the loan already happened. Payment totals. Recoveries. Settlement amounts.
Hover total_pymnt and the point lands immediately. It is the sum of payments already made. Knowing it means knowing part of the answer.
Signed Coefficients and SHAP, Side by Side
The output directory holds five plots, and their filenames describe a design decision rather than an accident.
Two of them are logistic_positive_coefficients.png and logistic_negative_coefficients.png. Splitting the coefficients by sign makes direction readable at a glance: this factor raises default risk, that factor lowers it. A credit reviewer or a compliance officer can quote a signed coefficient in a sentence. That is worth more in a lending context than a marginal gain in discrimination.
The other side is XGBoost, explained through xgboost_shap_summary.png and xgboost_feature_importance.png. SHAP values answer a different question. Not which way a factor pushes, but how much it pushed for this particular loan.
The concrete demonstration is local_shap_loan_263448.png, a per-loan attribution for a single applicant. Global importance tells you what the model cares about in aggregate. A local explanation tells you why this one borrower got this one score, which is the version of the answer a declined applicant would actually want.
Running both models on the same serialized preprocessing pipeline is what makes the pairing useful. Same inputs, same contract, two different kinds of explanation, neither one pretending to be the other.
Logistic Regression vs. XGBoost on This Pipeline
| Dimension | Logistic Regression | XGBoost |
|---|---|---|
| What it explains | Direction of each risk factor | Magnitude and interaction of each factor |
| Artifact in repo | logistic_positive_coefficients.png, logistic_negative_coefficients.png | xgboost_feature_importance.png, xgboost_shap_summary.png |
| Per-loan explanation | Not produced | local_shap_loan_263448.png |
| Regulatory readability | High: signed coefficients are quotable | Lower without SHAP |
| Handling of nonlinearity | None | Native |
| Preprocessing contract | SimpleImputer plus StandardScaler | Same serialized pipeline |
One deliberate omission: this table has no performance row. The repository contains a final_model_comparison.csv and several summary JSON files, but their contents were not available for inspection, and no AUC, F1, precision, or accuracy figure could be confirmed from anything actually visible. Inventing one to fill the row would be the same category of error the article opened with.
The Corrupted Backup
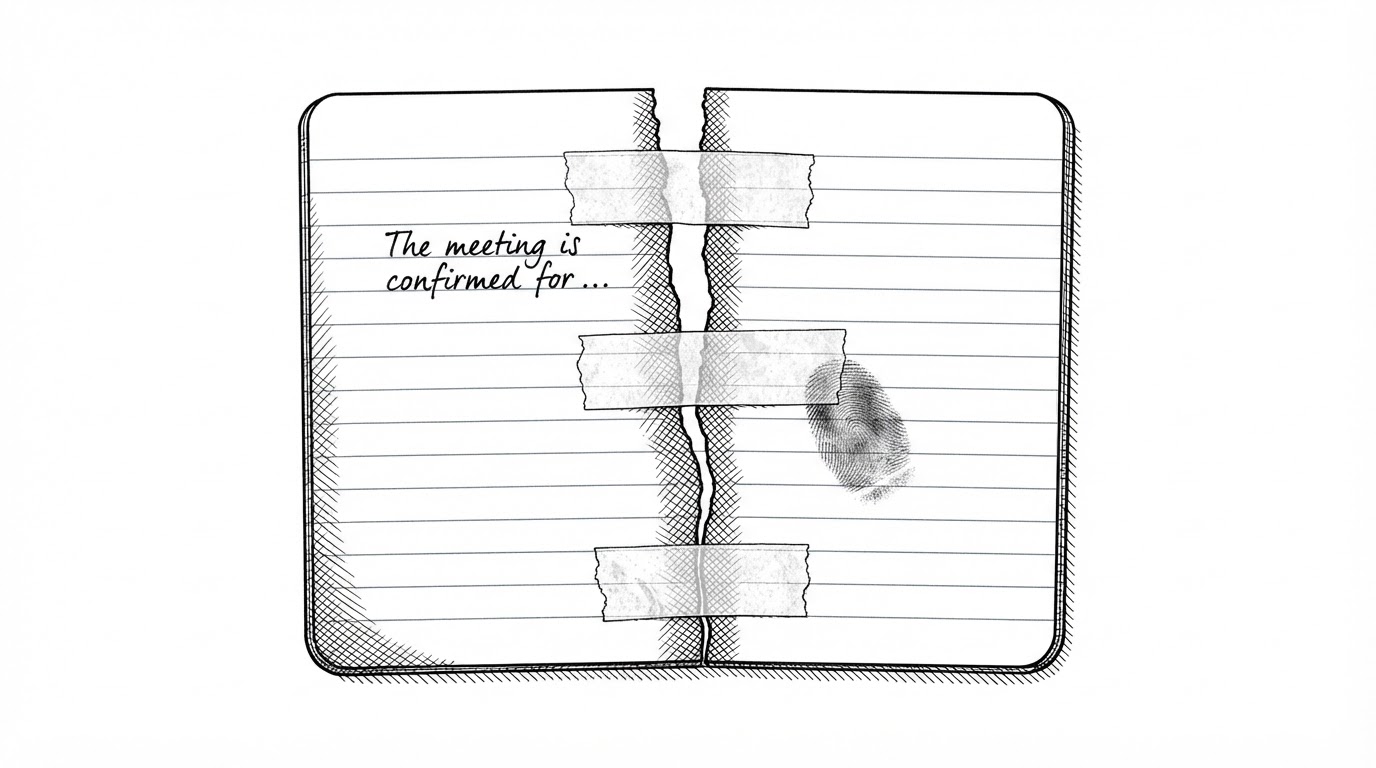
Here is the part that makes FinRisk more than a good feature list. The notebooks/ directory contains three training notebooks: modelTraing.ipynb, modelTraing_corrupted_backup.ipynb, and modelTraining_recovered.ipynb. Note the typo in the first two. It is in the committed filenames.
The recovered notebook shares cell IDs with the main one. The same identifiers appear in both files, which indicates that one was rebuilt from the other's session rather than written fresh. A notebook file was corrupted, work was recovered, and both the wreckage and the rebuild were committed to the repository.
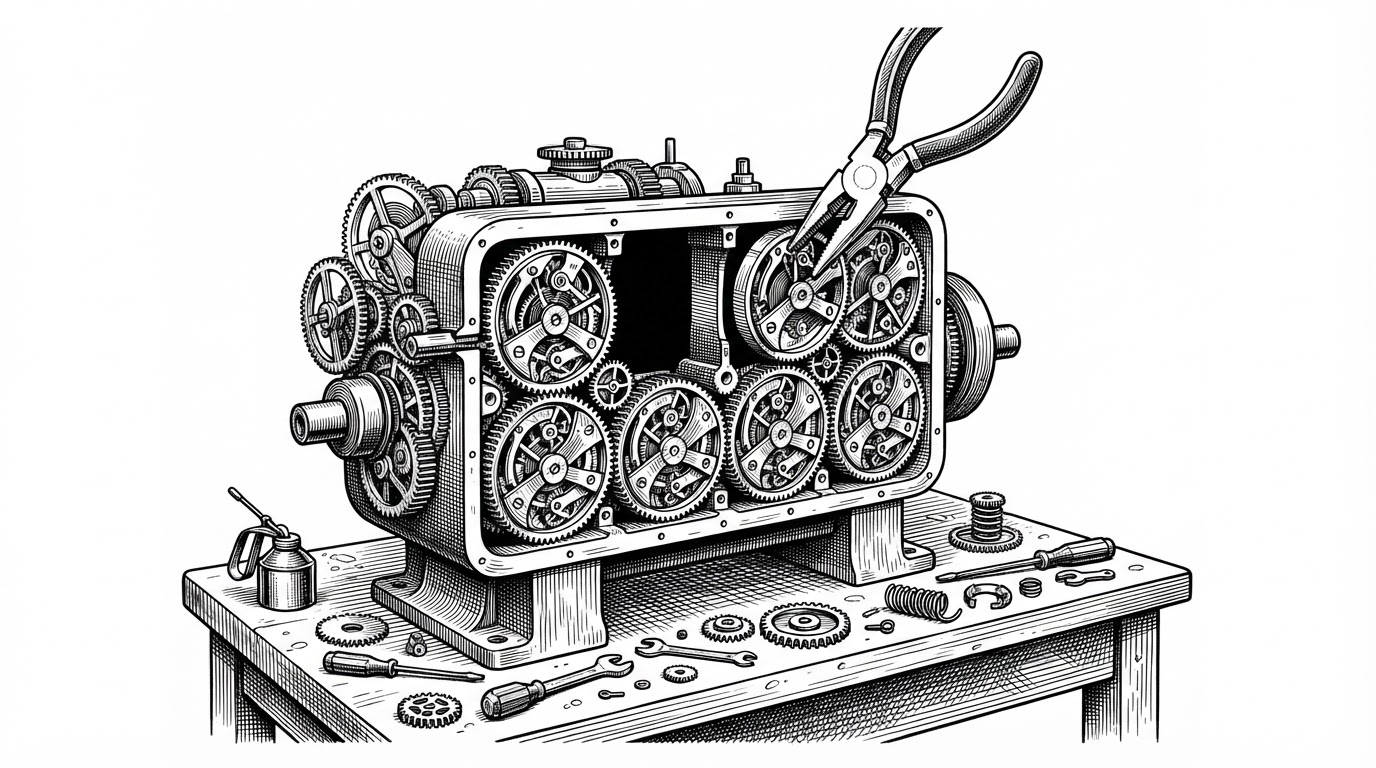
Most people would delete the backup before pushing. Keeping it is an accidental form of documentation. It shows exactly what a notebook-based pipeline costs when the notebook is the pipeline: no diffable source, no version control on the logic itself, just a JSON blob that either opens or does not.
The plumbing tells the same story. Four notebooks hardcode an absolute Windows path.
df = pd.read_csv('C:\\Users\\HP\\Documents\\finrisk\\data\\raw\\loan.csv')Other notebooks in the same repo use relative paths to the same kind of file. connect_to_sql.ipynb imports pandas twice. Its name promises a database connection, but the visible work is reading a CSV and synthesizing loan_id and borrower_id keys, presumably to make a flat Lending Club table behave like a normalized schema. Whether a MySQL connection was attempted and abandoned is an open question. The notebook's actual purpose appears to be key synthesis.
None of this is fatal. All of it is the ordinary texture of machine learning work done by one person in notebooks, and it is worth naming precisely because the modeling judgment in the same repository is better than the engineering around it.
The Interest Rate in the Room
FinRisk gets the leakage question right and leaves several other questions open.
int_rateis in the 70-feature list. The lender sets that rate during underwriting using its own risk grade, so a model that consumes it is partly learning the lender's prior opinion. It is common in Lending Club studies and it limits how independent the result can be.addr_state_*dummies appear at the EDA stage. Geography is a well-known proxy for protected characteristics in lending, and no fairness analysis is present in the visible material.- There is no license, which means no one has clear legal permission to reuse the code.
- There is no test suite despite
pytestin the stated stack. - The README mentions Streamlit deployment. No app code is in the repository.
There is also an unresolved question about the one-hot encoded features. The EDA produced grade_B through grade_G, sub_grade_*, purpose_*, home_ownership_*, and the state dummies. The modeled dataset reports zero categorical columns and 70 numeric features. Whether those encodings were folded into the processed CSV or dropped outright is not determinable from what is visible, and the difference matters. Dropping grade and sub_grade would mean the model deliberately ignores the lender's own assessment. Keeping them as numeric proxies would mean something else entirely.
The honest read is that FinRisk is a portfolio project that demonstrates one genuinely hard thing done correctly, wrapped in the fragile, non-portable plumbing that a lot of real work actually has. Zero stars and one contributor is not a reason to ignore it. It is a reason to read it as evidence rather than as a product.
The columns that are not there are the ones worth studying.