blue_tides: the Go server built to see where WebSockets break
It reads fixed-size frames from disk, pushes them through per-client egress channels, and logs the latency of every hop.
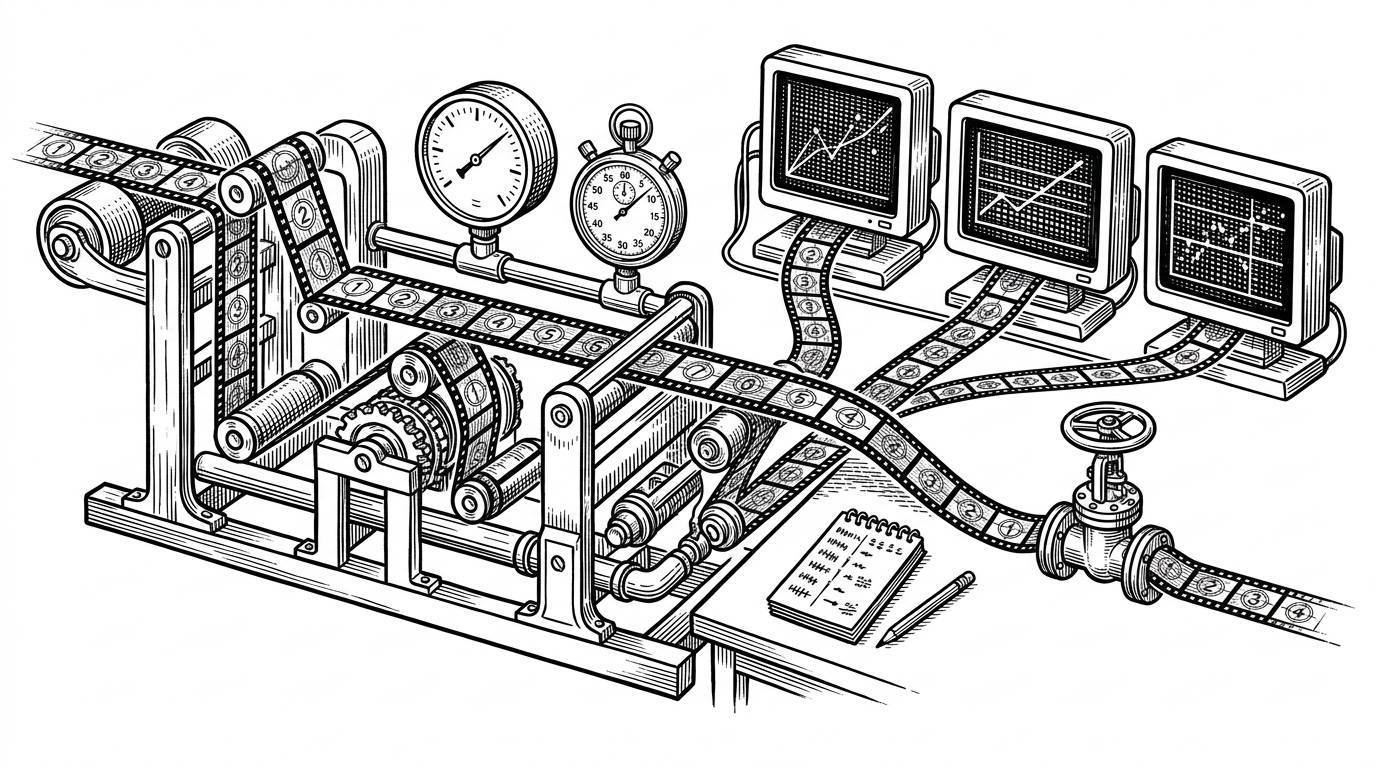
- blue_tides treats streaming as a measurement problem, not a playback problem.
- Its callback-to-channel bridge keeps file reads, socket writes, and timing logs separate enough to inspect under load.
- The single-writer WebSocket pattern turns concurrency pressure into a controlled queue instead of a race.
- The repo reads like a stress rig built to reveal where Go I/O becomes expensive, not like a finished media product.
This server is built to make pressure visible
The repo, blue_tides, is not trying to behave like a polished media stack. It is trying to answer a narrower question: what happens when a Go server has to move the same frame through disk, channels, and sockets without hiding the cost?
That is why the interesting part is not the fact that it streams. It is the way it exposes the handoff points. Every boundary, from file read to callback to WebSocket write, is a place where latency and backpressure can show up.
Why the code feels like a lab setup
The repository layout reads like a test bench. `server` and `server/websocket` handle connection management, `handler` owns the file and movie logic, `database` sits off to the side as a persistence wrapper, and `blue_tides.go` ties the whole experiment together.
That split matters because it keeps the streaming path legible. The code is not built around a product surface. It is built around one narrow pipeline, and that makes the tradeoffs easy to see.
func (m *Movie) PlayMovie(meta MovieMeta, send func([]byte), logFrame func(time.Duration)) {\n last := time.Now()\n m.ReadFile(int(meta.Scale), func(chunk []byte) {\n logFrame(time.Since(last))\n send(chunk)\n last = time.Now()\n })\n}\n\nfunc (c *Client) writeMessages() {\n for {\n select {\n case msg, ok := <-c.egress:\n if !ok {\n return\n }\n if err := c.Conn.WriteMessage(websocket.BinaryMessage, msg); err != nil {\n return\n }\n case <-c.done:\n return\n }\n }\n}The strange, elegant bridge between files and sockets
The sharpest idea in the repo is the callback-to-channel bridge. The file reader does not know about sockets. It just reads fixed-size chunks and hands each one to a function, which lets the rest of the system decide whether to measure, queue, or forward that chunk.
That separation is small, but it is the difference between a stream you can inspect and a stream that disappears into abstraction. Once the callback exists, timing can become a sidecar concern instead of being buried inside the network code.
One goroutine writes, and everyone else gets out of the way
The WebSocket side follows a classic Go rule, but the repo makes it concrete. Each client gets its own egress channel, the manager registers and unregisters sockets, and a dedicated write loop owns the actual socket writes.
That design does two jobs at once. It avoids concurrent write bugs on the same connection, and it turns congestion into something visible. If a client slows down, the queue is where you see it.
type Manager struct {\n ClientList map[*Client]bool\n Lock sync.RWMutex\n}\n\nfunc (m *Manager) ServeWs(w http.ResponseWriter, r *http.Request) {\n conn, _ := upgrader.Upgrade(w, r, nil)\n client := &Client{Conn: conn, egress: make(chan []byte, 32)}\n\n m.Lock.Lock()\n m.ClientList[client] = true\n m.Lock.Unlock()\n\n go client.readMessages()\n go client.writeMessages()\n}The important part is not just that the code is concurrent. It is that the concurrency is disciplined. One goroutine owns the writer, channels absorb the traffic, and the manager keeps the client roster coherent.
The timestamp log is the real product
The sidecar timestamp log turns the repo from a stream demo into a measurement tool. Every frame can be timed as it moves, which means the project is interested in latency, not only throughput.

That is why the repo feels more like a harness than an app. A throughput number can flatter a system. A per-frame log shows where the pipeline is actually paying for time.
What blue_tides is, and what it is not
The easiest mistake is to compare it to a generic broadcast server or a production media streamer. That misses the point. blue_tides is closer to a stress rig with a streaming shape, built to make the cost of each hop legible.
| Dimension | Generic WebSocket broadcast server | blue_tides |
|---|---|---|
| Data source | Arbitrary messages from handlers or pub-sub | Fixed-size chunks read from disk with a frame scale |
| Write model | Often many paths can try to write | One writer goroutine per socket |
| Backpressure | Usually hidden inside shared broadcast logic | Visible in per-client egress channels |
| Latency visibility | Throughput first, timing second | Per-frame timing log is built in |
| Primary use | Chat, notifications, live updates | Stress test and measurement rig |
| Failure mode | Race conditions or tangled locks | Queue growth and slower frame delivery |
That distinction explains the whole design. The fixed chunk size, the single-writer socket path, and the timing log all point to the same goal: reveal pressure before it becomes a mystery.