LBDashboard: The Scrappy Pipeline That Turns Letterboxd Logs Into Film Intelligence
A clever Python script bridges Letterboxd, TMDB, and Power BI, using page scraping, cached joins, and crew-level metadata to turn personal movie history into something closer to an analyst’s workbook.
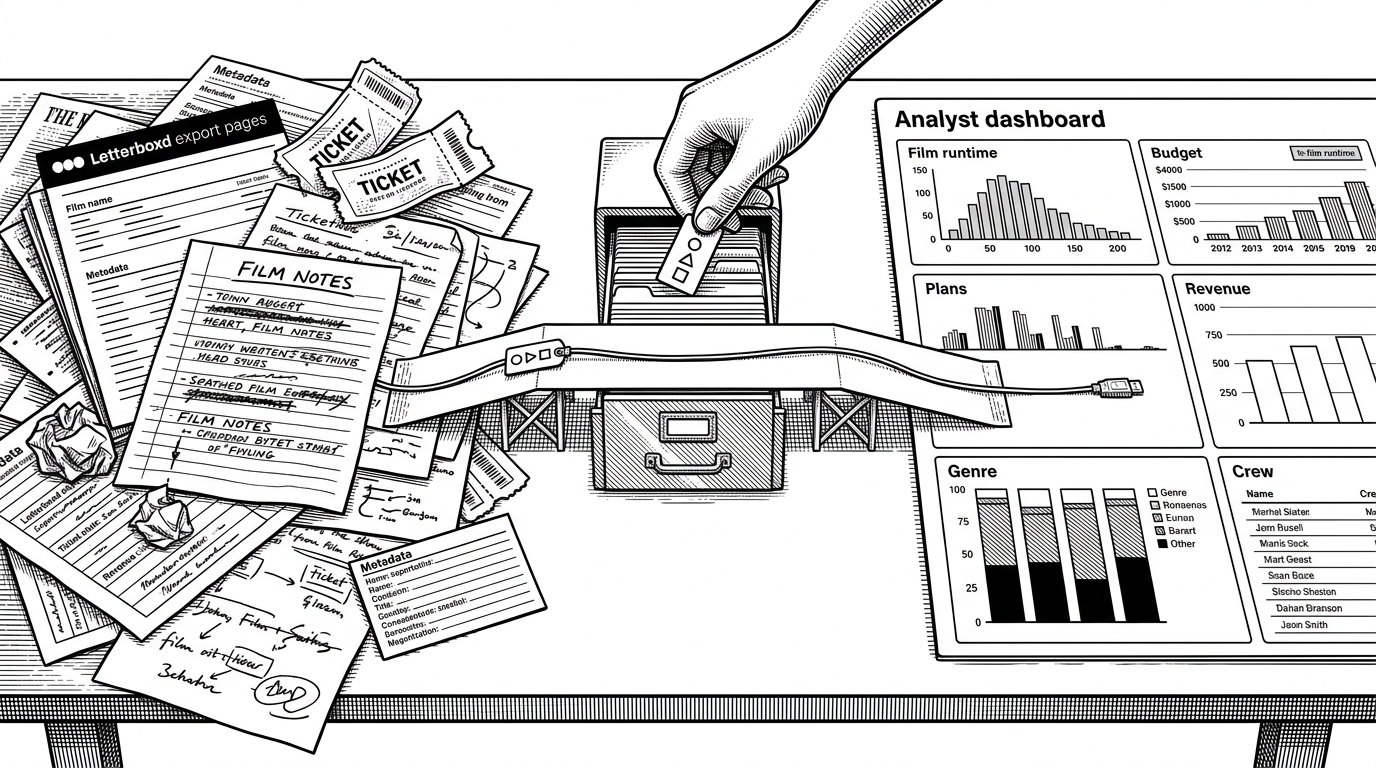
- LBDashboard’s smartest move is not the dashboard, but the identity bridge that recovers a TMDB key from the Letterboxd page itself.
- The project treats CSV files like a lightweight database, using cached joins to avoid repeated work and keep the pipeline inspectable.
- Its metadata model is cinephile-first, because it cares about editor and director of photography as much as cast and revenue.
- Power BI is only the last mile, which makes the whole system feel more like a clean ETL workbook than a generic movie charting app.
The hard part is not visualization. It is identity.
Letterboxd gives you a history of what you watched. TMDB gives you the richer film record. The problem is that they do not naturally meet on the same key, which is why so many hobby analytics projects end up leaning on fuzzy title matching and hoping for the best.
LBDashboard takes a cleaner route. Its core trick is to scrape the Letterboxd film page for the TMDB link, then use that exact identifier to enrich the record. That one move changes everything. It replaces guesswork with a reliable bridge, and once identity is solved, the rest of the pipeline becomes straightforward.
How LBDashboard builds a clean film record
The repository is organized like a practical glue-code project. There is a single Python orchestrator, `createDataset.py`, a batch launcher in `run.cmd`, a handful of CSV files that behave like a local database, and a Power BI file at the end of the chain. That flat shape is not a weakness. It is the point.
# Simplified pipeline shape
ratings = pd.read_csv('ratings.csv')
cached_ids = pd.read_csv('ratings_con_id.csv')
new_films = ratings.merge(cached_ids, how='left', on='letterboxd_url')
new_films = new_films[new_films['tmdb_id'].isna()]

for film in new_films:
    tmdb_id = get_tmdb_id(film['letterboxd_url'])
    movie = tmdb.movie(tmdb_id).info()
    credits = tmdb.movie_credits(tmdb_id).info()
    # extract budget, revenue, runtime, genres, countries, director,
    # screenplay, editor, and director of photography

output.to_csv('dataset_pelis.csv', index=False)
The script behaves like a small ETL system. It extracts watched films from Letterboxd, transforms them with TMDB metadata, and loads the result into a dataset that Power BI can consume. CSVs stand in for persistence, pandas handles the joins, and the cache file prevents the same identity lookup from being repeated over and over.
That is the quiet sophistication here. Nothing is over-engineered. But nothing important is hand-waved either. The project keeps enough state to be useful, yet stays transparent enough that a non-specialist can inspect the files and understand what happened.
Why the metadata choices feel cinephile-first
Most movie dashboards stop at title, genre, cast, maybe runtime. LBDashboard goes further. It explicitly pulls editor and director of photography, which says a lot about the project’s taste. It treats film as a craft object, not just a celebrity object.
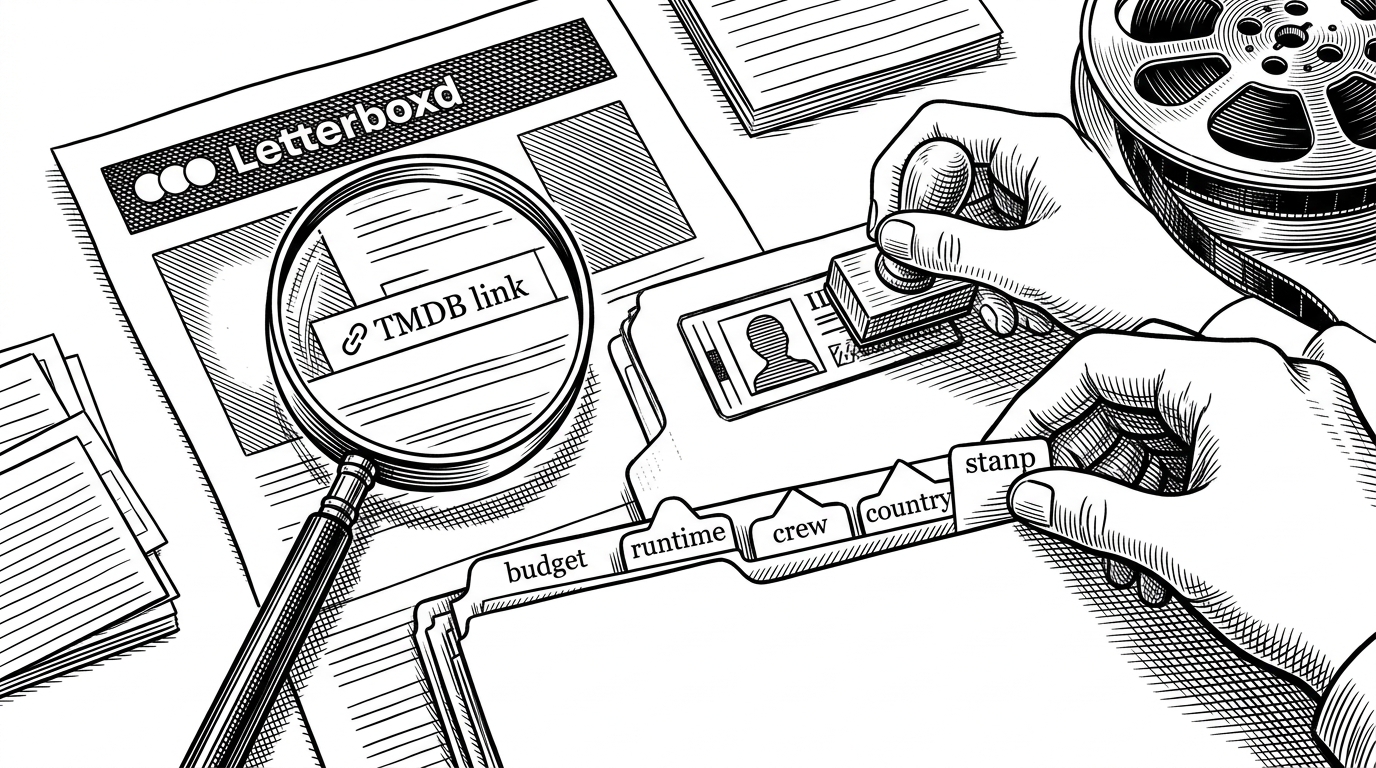
The inclusion of `directoras.csv` adds another layer of intent. This is not just a personal archive of what was watched. It is a lens for asking who made the films, and whether a viewing history reflects a broader range of filmmakers. That makes the dashboard feel analytical in a human sense, not just a numerical one.
Even the credits extraction is selective in a revealing way. The code does not simply hoover up every crew role. It looks for director, screenplay, editor, and director of photography. Those are the kinds of fields that matter when you care about how a film is made, not just who starred in it.
Power BI is the final layer, not the point
The `.pbix` file is the presentation layer. It is where the cleaned dataset becomes something legible, interactive, and shareable. But it does not drive the project’s identity. The real work happens before the report ever opens.
| Layer | Generic movie dashboard | LBDashboard |
|---|---|---|
| Identity resolution | Often relies on title search or loose matching | Recovers the TMDB bridge key from the Letterboxd page |
| Metadata depth | Usually stop at cast, genre, and runtime | Adds budget, revenue, countries, editor, and director of photography |
| State management | Single import or ad hoc spreadsheet | CSV cache plus merge logic to avoid repeat work |
| Taste | Charts first | Craft-aware film analysis first |
| Output | A dashboard | A small analyst pipeline that happens to end in Power BI |
That difference matters because Power BI is only useful when the upstream data is trustworthy. LBDashboard understands that. It does the boring work first, then lets the dashboard do the talking.
What this project does better than a generic movie dashboard
A generic dashboard usually asks, “What did I watch?” LBDashboard asks a better question: “Can I build a record precise enough to analyze film the way an analyst would?” That means exact identity, richer metadata, and a model that can support more than a few vanity charts.
The project is also more opinionated than it looks. By choosing to surface behind-the-camera roles, it nudges the viewer toward film craft. By caching IDs, it turns an unstable web lookup into a repeatable local workflow. By stopping at CSV and Power BI, it stays simple enough to survive in one person’s toolchain.
Limits, fragility, and why that matters
The same choices that make LBDashboard elegant also make it fragile. The scraping step depends on Letterboxd’s page structure. If that HTML changes, the bridge can break. The codebase also reads like a personal utility, not a hardened product, which is part of its charm and part of its ceiling.
That fragility is not incidental. It is a sign of the project’s real shape. This is a practical, highly specific tool built to solve one user’s problem well, not a platform trying to abstract away every edge case. For a repo like this, that is often the right trade-off.
There is also an obvious security smell in the source, since the repository exposes a visible API key pattern in the code. That does not change the value of the pipeline, but it does remind you that many useful open-source projects are assembled from expedient parts before they are polished into something reusable.
Why LBDashboard is interesting anyway
The best way to read LBDashboard is as a pattern. Start with messy hobby data. Find one reliable identity bridge. Cache the result. Enrich the record. Then let a reporting tool handle the last mile.
That pattern is useful far beyond movies. It is how a lot of sharp, small analytics projects work in practice: not by inventing a new platform, but by connecting existing ones with a tiny amount of good judgment. LBDashboard is a good example because it knows exactly where the hard part lives, and it solves that part first.