chrome-devtools-mcp: Giving AI a Chrome DevTools Brain
A Google-built MCP server that turns browser debugging, performance tracing, and runtime inspection into tools an agent can actually use.

- chrome-devtools-mcp is best understood as a translation layer that turns Chrome’s overwhelming runtime detail into evidence an agent can actually use.
- Its real edge is not browser access, but interpretation: snapshots, formatters, scoped context, and waiting logic reduce noise without hiding the truth.
- The session model and mutex-based execution keep fast, tool-happy agents from stepping on their own state.
- The repo reads like production infrastructure, with telemetry, eval scenarios, and slim mode shaped around real agent workflows rather than demos.
AI Doesn’t Need a Bigger Browser. It Needs a Better Lens.
The easy pitch is that an AI agent can now open Chrome. The better pitch is that the browser is finally being made legible to the model. Raw DOM, logs, traces, and network chatter are too noisy to fit inside an LLM’s attention without losing the plot.
That is why chrome-devtools-mcp matters. It is not just a remote-control layer for Chrome. It is an interpretation layer that turns browser reality into signals an agent can inspect, compare, and act on without guessing.
Coding agents face a fundamental problem: they are not able to see what the code they generate actually does when it runs in the browser. They're effectively programming with a blindfold on.
What Google Actually Built
The project comes from the Chrome DevTools team and targets coding agents that need more than clicks and screenshots. The point is to expose browser debugging, performance tracing, and runtime inspection through MCP so a model can reason over what actually happened in the page.
That sounds obvious until you look at the design. This is not a thin Puppeteer wrapper with a chatbot on top. The repo is arranged around the idea that browser data must be curated before it becomes useful to an agent.
offload runtime errors and warning checks that I used to do manually in the browser.
The Repo’s Real Trick: It Translates Browser Noise Into Agent Signals
The most interesting code path is the one that removes information. Snapshot formatters condense the DOM. Issue formatters turn DevTools warnings into text a model can use. UID replacement keeps schemas from ballooning into unreadable blobs of HTML.
That is the opposite of naive automation. Instead of exposing every raw browser detail, the server chooses what to preserve and how to phrase it. The model gets a smaller but sharper view of the page, which matters more than full fidelity if the goal is reliable action.

How the Session Model Keeps the Agent From Tripping Over Itself
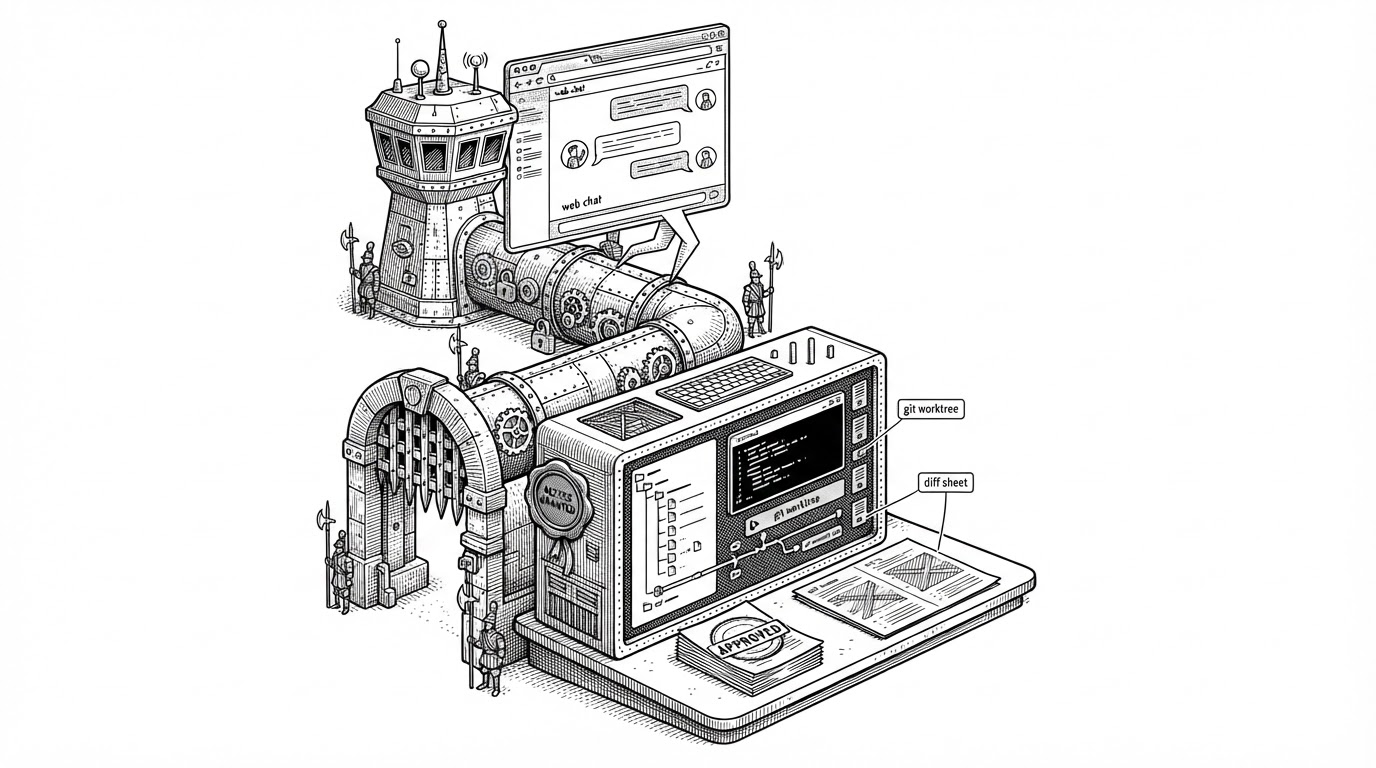
The session layer matters because agents are impatient. They chain actions quickly, and browser state is famously easy to corrupt when multiple commands overlap. The repo uses a context object, page wrappers, isolated contexts, and mutex-style serialization to keep that from happening.
That is a product decision disguised as plumbing. If the server cannot keep the browser coherent under rapid tool calls, the model learns the wrong lesson from good code. Reliability here is not about elegance. It is about not letting state leak across actions.
// Simplified idea, not exact repo code
await mutex.runExclusive(async () => {
  const page = context.getPage(pageId);
  await page.performToolAction(toolArgs);
  await page.waitForStableState();
});
Waiting Is a Product Feature
Waiting is where many browser tools quietly fail. A fixed sleep is a guess. A good agent-facing wait should tell the model something meaningful about whether the page is actually ready.
That is what makes WaitForHelper interesting. It adapts to CPU throttling and network conditions, so the agent is not just waiting longer. It is waiting in a way that tracks the browser’s real conditions.
The result is subtle but important. Completion becomes a signal, not a superstition. That is the difference between an automation script and a tool an agent can trust.
Generating illustration...
Why This Isn’t Just Playwright MCP With a Chrome Sticker
| Tool | Primary strength | What the agent gets | How deep debugging goes | Browser scope | Best use case | Limitation |
|---|---|---|---|---|---|---|
| chrome-devtools-mcp | DevTools-grade inspection and performance signals | Snapshots, console, network, traces, issues | Very deep, especially for runtime diagnosis | Chrome-centric | Debugging, tracing, and evidence-based fixes | Less focused on cross-browser breadth |
| Playwright MCP | Broad browser automation | Actions, assertions, page control | Good for automation, less DevTools-native | Cross-browser | General testing and scripted workflows | Less specialized for Chrome runtime insight |
| Generic Puppeteer or CDP | Low-level browser control | Raw automation primitives | Depends on what the wrapper exposes | Chrome and CDP-compatible browsers | Custom internal automation | The model must infer too much from raw output |
The comparison is simple. Playwright MCP is browser automation. chrome-devtools-mcp is browser introspection with debugging semantics. That specialization matters whenever the task is not just to click through a flow, but to explain why the flow broke.
The Mature Part: Telemetry, Eval Scenarios, and Slim Mode
The repo also behaves like infrastructure. Telemetry records tool behavior. Eval scenarios test whether the agent can solve real web problems, not just invoke endpoints. Slim mode trims the tool surface when a task does not need the full set of capabilities.
That combination is a clue about the project’s intent. Google is not treating agentic browsing as a demo loop. It is treating it as a system that needs observability, quality gates, and a deliberate budget for complexity.
In that sense, the repo’s maturity is the point. It assumes that browser control alone is easy, but dependable browser sense-making is hard.