CodeBurn: The Local-First Receipt for AI Coding Waste
It reads the session logs your tools already leave on disk, classifies where the tokens went, and shows why productive agent work often burns money on retries, rereads, and conversation.

- CodeBurn turns AI coding spend into a local forensic problem, so the waste shows up before the invoice does.
- Its real edge is task-level diagnosis, not aggregate accounting, because it separates coding, debugging, conversation, and retry loops.
- The tool stays privacy-first by reading session artifacts already on disk instead of proxying traffic or shipping logs to a SaaS backend.
- Its pricing guardrails and optimization heuristics make the output defensible enough to act on, not just interesting to stare at.
CodeBurn starts from a simple annoyance: AI coding tools feel fluid while the bill arrives fragmented and opaque. The big number is not the story. The story is the hidden tax inside the loop, where rereads, retries, and chatty detours quietly burn more than the actual edits.
Built this after realizing I was spending ~$1400/week on Claude Code with almost no visibility into what was actually consuming tokens.
Why CodeBurn is local-first, not proxy-first
Most cost tools start by watching traffic. CodeBurn starts by reading the residue already on disk: JSONL transcripts, SQLite databases, worktree markers, and provider-specific session files. That choice matters because it keeps sensitive code local and avoids the friction of API wrappers, proxies, and SaaS backends.
| Tool | Data source | Privacy model | Level of insight | Best for |
|---|---|---|---|---|
| CodeBurn | Local session logs, SQLite, JSONL | Fully local | Task-level, diagnostic | Teams and heavy agent users who need to know why spend happened |
| ccusage | Local usage data | Local | Aggregate cost and token totals | Quick audits and simple usage tracking |
| Claude Code /stats | Built-in app stats | Local | Basic usage summary | Fast glance at native stats |
| Cloud dashboards | Proxy or uploaded telemetry | Remote service | Visual reporting, often aggregated | Centralized reporting when privacy is less important |
The archaeology engine
The core trick is not just file reading. It is attribution. CodeBurn walks project trees, resolves canonical paths, and maps each turn back to the right workspace even when the AI ran inside a temporary subdirectory or a messy worktree. That is what makes the output feel forensic instead of approximate.
// Conceptual flow inside CodeBurn
raw logs -> parseJsonlLine -> ClassifiedTurn -> SessionSummary

// The important part is project attribution.
// resolveCanonicalProjectPath walks upward until it finds
// a stable .git marker or worktree root, then binds spend
// to the project people actually care about.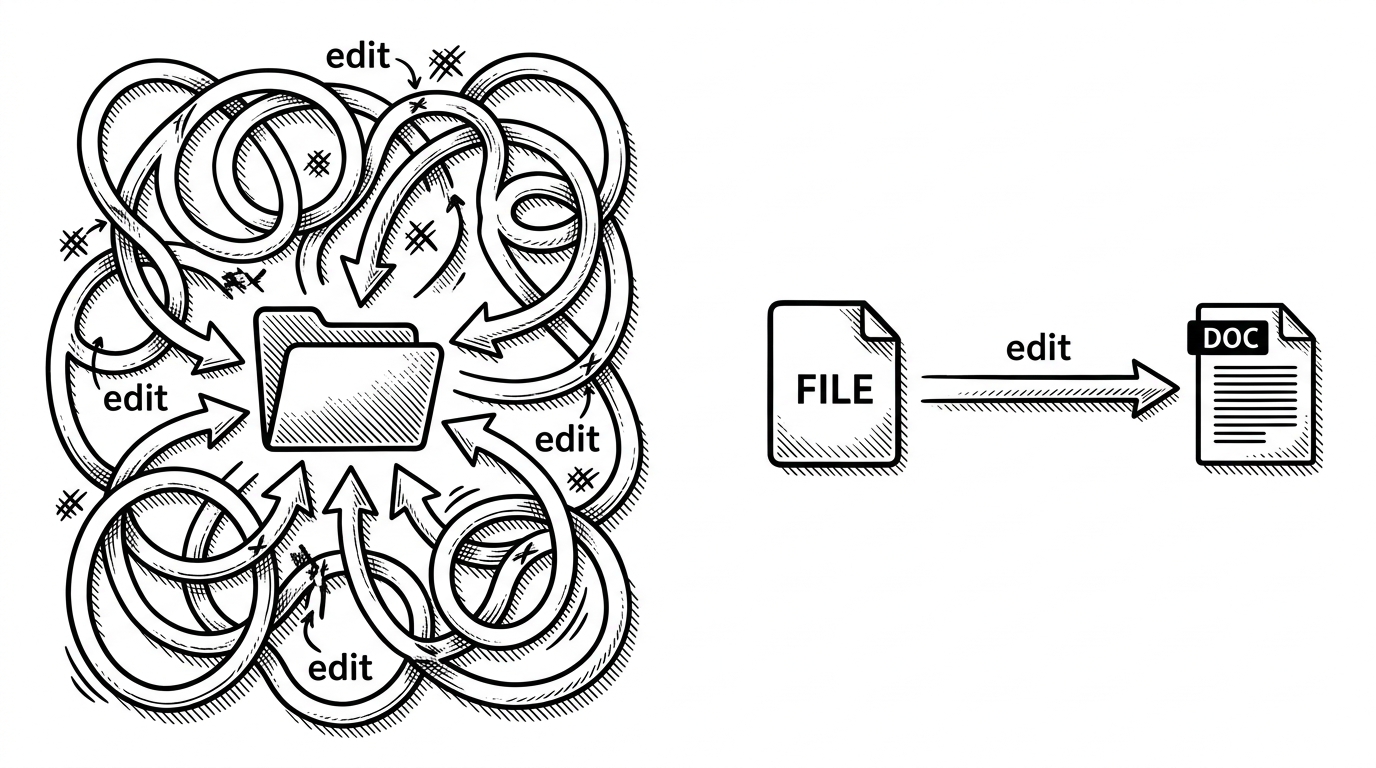
The session parser also has to survive huge log lines, odd provider schemas, and missing native dependencies. That is why the provider layer is modular and lazy-loaded. One broken parser should not take down the whole CLI.
Why the provider pattern matters
CodeBurn’s `src/providers/` directory is the real scalability story. Each tool gets its own parser, but they all emit the same normalized shape. That lets the project absorb new agents without turning the core into a pile of special cases.
| Design choice | What it buys | Trade-off |
|---|---|---|
| Per-provider parsers | Fast support for new AI tools | More surface area to maintain |
| Lazy loading | Short startup time and fewer hard crashes | Errors show up later, at the edge |
| Normalized turn model | Shared analytics across many tools | Some provider-specific detail gets abstracted away |
| Deterministic classification | Predictable metrics without LLM calls | Rules need periodic tuning |
// Provider modules stay isolated and are loaded only when needed
const provider = await import(`./providers/${name}.ts`)

// That way, one missing native SQLite dependency
// does not break support for every other tool.
CodeBurn does more than count tokens
The project gets interesting when it stops reporting spend and starts judging behavior. It measures savings against a baseline frontier model, tracks one-shot success rates, and looks for low read-to-edit ratios. Those are operational signals, not vanity stats.
A session that spends heavily on conversation turns is not the same as a session that spends heavily on edits. CodeBurn separates those cases, then uses the difference to produce optimization advice. That is why the optimize command feels more like a linter for agent behavior than a dashboard widget.
| Metric | What it reveals | Why it matters |
|---|---|---|
| Conversation share | How much spend went to chat versus output | High values often mean the agent is circling instead of building |
| One-shot success rate | How often edits land without retries | Low rates point to wasted loops |
| Read:edit ratio | How much rereading happens before a change | A classic sign of token burn |
| Savings vs baseline | What local or cheaper models save versus frontier defaults | Turns model choice into a concrete ROI story |
The pricing guardrails
Cost tooling is only useful if the numbers are credible. CodeBurn keeps bundled pricing snapshots, refreshes live data from LiteLLM, and applies heuristics when providers do not state cache pricing cleanly. It even caps absurd rates with a safety brake so bad input cannot create absurd output.
// Conceptual guardrail
const rate = safePerTokenRate(rawRate)

// If the source data is broken, the analysis stays bounded
// instead of showing a nonsense bill.
How it compares to ccusage, Claude Code stats, and cloud dashboards
This is not a prettier version of existing tooling. It is a different instrument. ccusage is useful for aggregate auditing. Claude Code’s built-in stats are useful for a quick check. Cloud dashboards are useful when a team wants centralized reporting. CodeBurn is built for the moment you need to answer a different question: what kind of work consumed the money?
| Tool | Strength | Blind spot |
|---|---|---|
| CodeBurn | Local, task-level diagnosis | Less interested in polished SaaS reporting |
| ccusage | Simple aggregate cost tracking | Does not go as deep on behavior |
| Claude Code /stats | Convenient native baseline | Thin on explanation and optimization |
| Cloud dashboards | Central visibility | Privacy and proxy overhead |
That distinction is why privacy-sensitive teams may prefer CodeBurn even if they already have a dashboard elsewhere. The tool is not just counting. It is interpreting.
What CodeBurn says about the AI coding era
If AI coding tools are becoming a work surface, observability has to move closer to the machine and closer to the user. CodeBurn is a strong example of that shift. It treats session residue as something worth preserving, classifying, and learning from on the local box before any central system gets involved.
One surprising result: about 56% of my spend was on conversation turns with no tool usage. Actual coding (edits/writes) was only ~21%.
That is the deeper value of CodeBurn. It turns AI spend into a behavioral signal. Once you can see the loop, you can fix the loop.