CodeBurn: The Local Ledger for AI Coding Agents
A zero-config observability tool that reads agent logs off disk, classifies work by intent, and exposes the hidden cost of retries, wasted context, and failed loops.

- CodeBurn turns local agent logs into an auditable ledger, so AI coding spend becomes visible without proxies, API keys, or cloud telemetry.
- Its real edge is not raw tracking but interpretation, because one-shot success and waste detection expose where token burn actually happens.
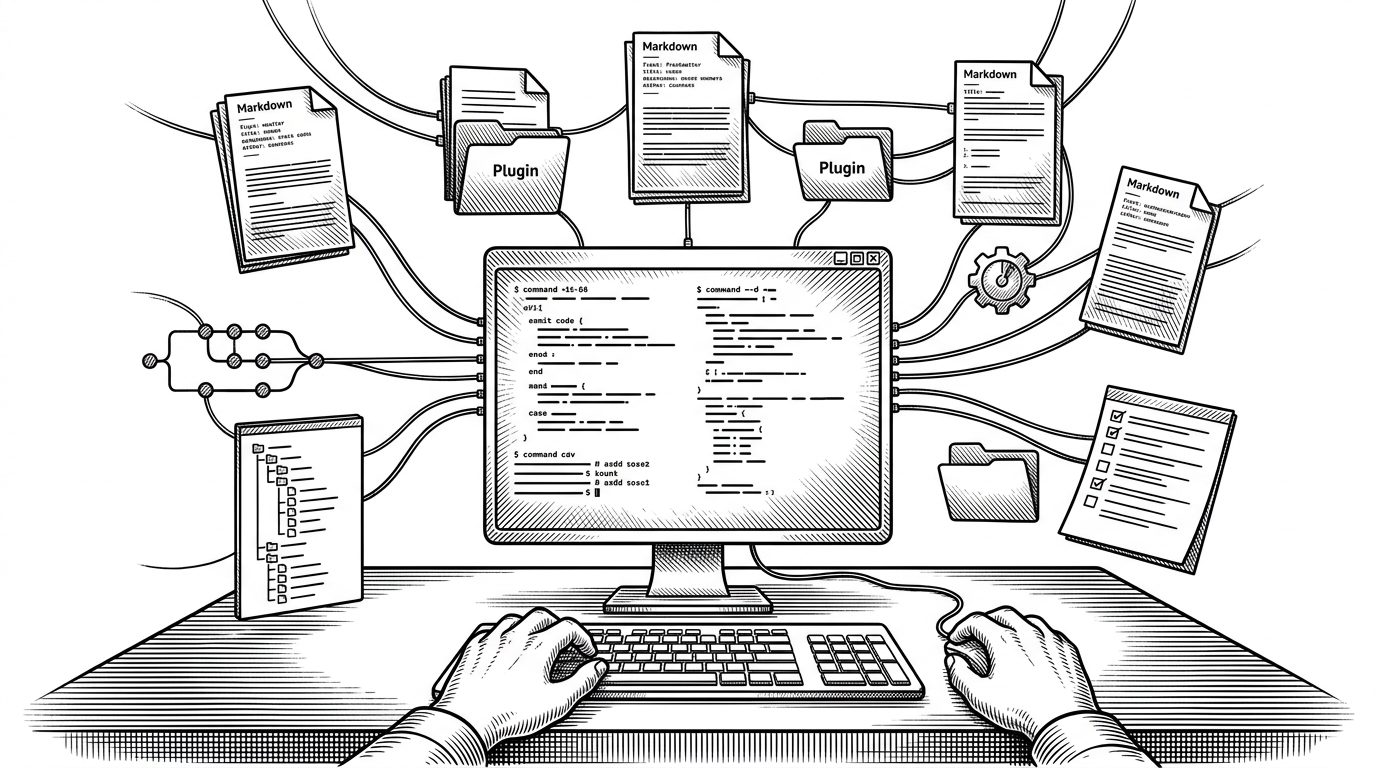
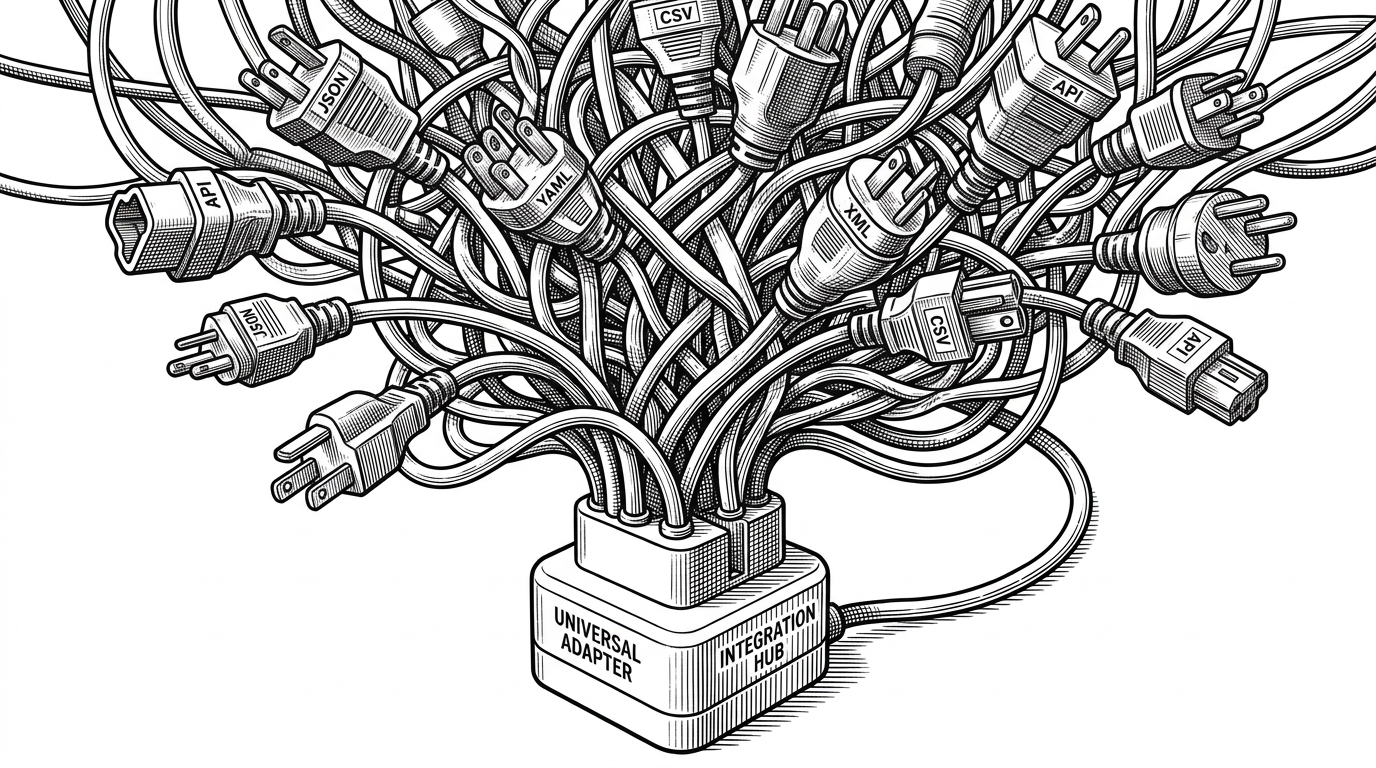
- The plugin model lets very different storage formats collapse into one session schema, which makes multi-provider analysis feel surprisingly uniform.
- The optimize command changes the product from reporting to diagnosis by pointing at specific retry and context-waste patterns.
The hidden bill in AI coding is not the model call itself. It is the loop around it: retries, repeated file reads, dead-end tool use, and context that gets loaded again because the first attempt missed. CodeBurn exists to make that bill visible from the same machine where the work happened.
See where your AI coding tokens go.
Why CodeBurn reads the disk instead of your API traffic
Most observability tools watch requests as they pass through a proxy. CodeBurn makes a different bet: the important truth already lives on disk in local session data, so it can be recovered after the fact without sitting in the traffic path. That is why the project can stay local-only, avoid API keys, and still reconstruct what happened across tools like Claude Code, Cursor, and Copilot.
A plugin system for messy agent data
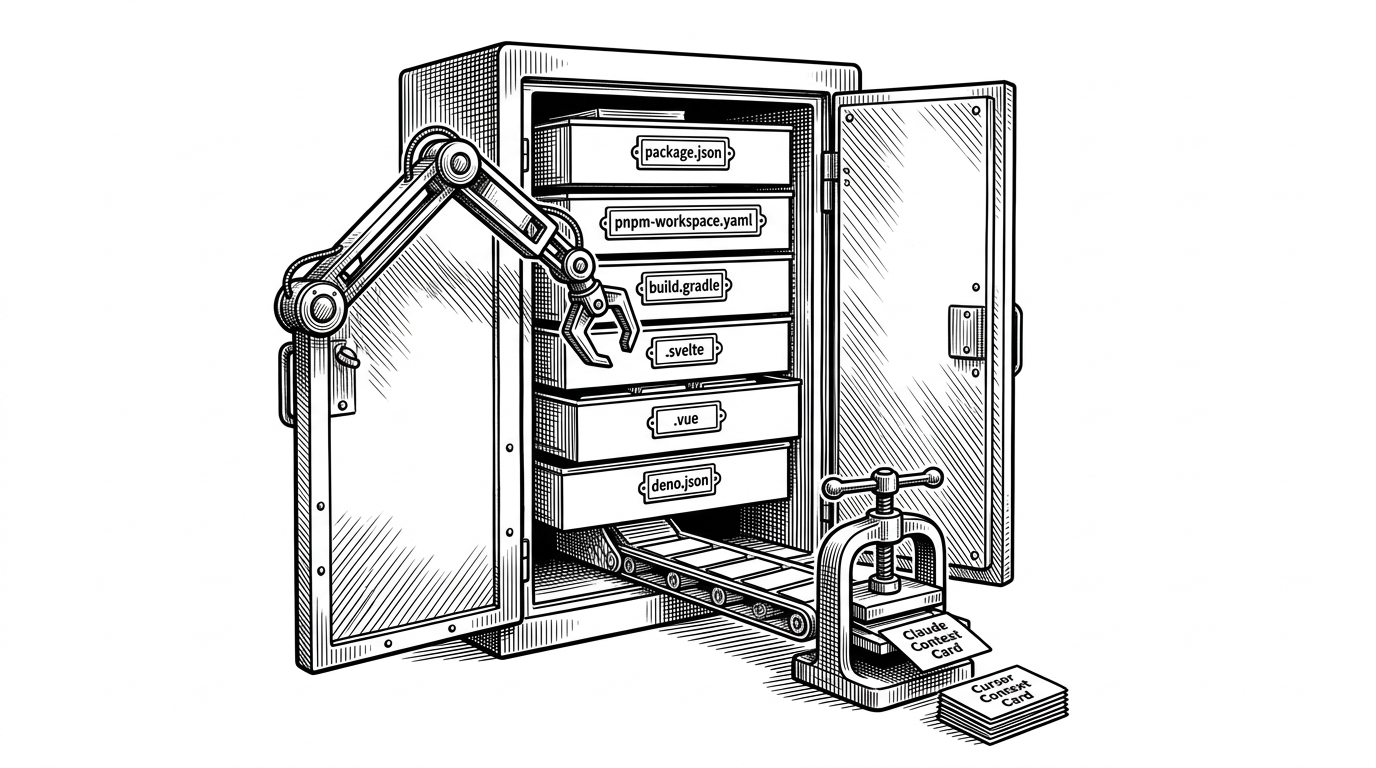
The provider layer is the project’s quiet superpower. Claude sessions live as JSONL, Cursor hides useful state in SQLite, and other tools keep their own shape of data, but CodeBurn makes each source look like the same kind of input once it passes through a provider adapter. The hard part is not the interface. The hard part is respecting how different each storage format really is.
| Tool | Data source | Setup burden | Provider coverage | Cost accuracy | Efficiency analysis | Best for |
|---|---|---|---|---|---|---|
| CodeBurn | Local logs and local databases | Low | Multi-provider | High | Yes, including one-shot and waste | Private post-run analysis |
| Claude Usage Dashboard | Local Claude logs | Low | Single-provider | High | Limited | Claude-only spend tracking |
| Helicone-style proxy observability | Request proxy | Medium to high | Broad | High for routed traffic | Usually focused on tracing | Runtime telemetry and app-wide monitoring |
| Simple CLI token scripts | One provider export or text parse | Low | Narrow | Variable | No | Quick rough totals |
That table is the point. CodeBurn is not trying to win on runtime tracing or enterprise telemetry. It wins when the question is narrower and more urgent: what did these local AI coding sessions actually cost, and did they do anything useful with that spend?
The classifier is where observability becomes judgment
This is the brain of the system. Raw events get grouped into turns, turns get classified, and those labels become the basis for cost and efficiency analysis. A turn is not just a log chunk. It is a decision point, which is why CodeBurn can separate coding from exploration, retries, shell-heavy work, and other patterns that matter when you are trying to understand wasted token burn.
export function classifyTurn(turn: Turn): TaskCategory {
  if (hasEditActivity(turn)) return 'coding';
  if (hasSearchOrGrep(turn)) return 'exploration';
  if (hasRepeatedFailure(turn)) return 'retry-heavy';
  if (hasShellLoop(turn)) return 'tooling';
  return 'other';
}

export function groupIntoTurns(events: Event[]): Turn[] {
  // Collapses raw session events into user-plus-assistant work units
  // so cost, success, and waste can be analyzed together.
  return [];
}
The interesting move is semantic, not cosmetic. CodeBurn does not stop at counting tokens. It tries to infer what kind of work those tokens bought, and whether the first pass solved the problem or just created another loop.

The dashboard is a terminal app that behaves like a web app
CodeBurn’s Ink-based TUI is the practical proof that terminal software does not have to feel primitive. Keyboard navigation, multi-panel layouts, and smooth gradient bars make the numbers easy to scan, but the real win is feedback density. You can move from overview to breakdown without leaving the same mental frame.
Works by reading session data directly from disk. No wrapper, no proxy, no API keys.
What CodeBurn sees that simpler dashboards miss
| Capability | CodeBurn | Simpler dashboards |
|---|---|---|
| Local collection | Reads from disk | Often depends on a proxy or export |
| Provider coverage | Multiple agent tools | Usually one tool |
| One-shot success | Tracked per activity type | Rarely surfaced |
| Waste analysis | Built in | Usually absent |
| Optimization | Suggests fixes after the run | Stops at totals |
That difference matters because totals are easy to admire and hard to act on. If a tool can tell you that you spent money, but not where the repeated failure happened, it leaves the expensive part untouched.
Why optimization matters more than reporting
The optimize command is where CodeBurn stops being a mirror and starts acting like a reviewer. It scans for repeated shell failures, reread-heavy context, and other forms of waste that hide inside apparently productive sessions. In other words, it does not just measure burn. It points to the habits that caused it.
That is why CodeBurn reads more like workflow forensics than analytics. It is built for people who already know AI coding can be useful and now want to know when it is being wasteful.
Sources and ecosystem
This submission was not made through the required web form. As noted in CONTRIBUTING.md, recommendations must be submitted using the web form.
CodeBurn sits in a small but telling ecosystem. It borrows the broad instinct from ccusage, leans on pricing data from LiteLLM, and uses Frankfurter for exchange rates, but its own thesis is sharper: local logs are enough to explain the bill if you are willing to reverse engineer them. That makes it useful in a way most dashboards are not. It is private, immediate, and opinionated about what counts as useful work.