CodeBurn: The Forensics Tool for AI Coding Spend
It reads local session logs from Claude Code, Cursor, and other agents, then reconstructs your token bill, cache behavior, and subscription waste without proxying a single request.

- CodeBurn turns local AI agent exhaust into an auditable bill, which makes hidden spend legible without putting a proxy in the middle.
- Its real differentiation is forensic collection, not prettier analytics: parsers, canonical project grouping, and pricing snapshots all happen locally.
- The tool treats cache behavior and subscription thresholds as first-class signals, so it is built for optimization rather than hindsight alone.
- CodeBurn fits a new category of AI stack observability that is developer-native, privacy-preserving, and broad enough to span multiple coding assistants.
The hidden bill behind AI coding
AI coding feels abundant until the receipts show up. The cost is not just tokens. It is the repeated re-reading of context, the conversations that never become edits, and the mismatch between a subscription plan and the work actually done.
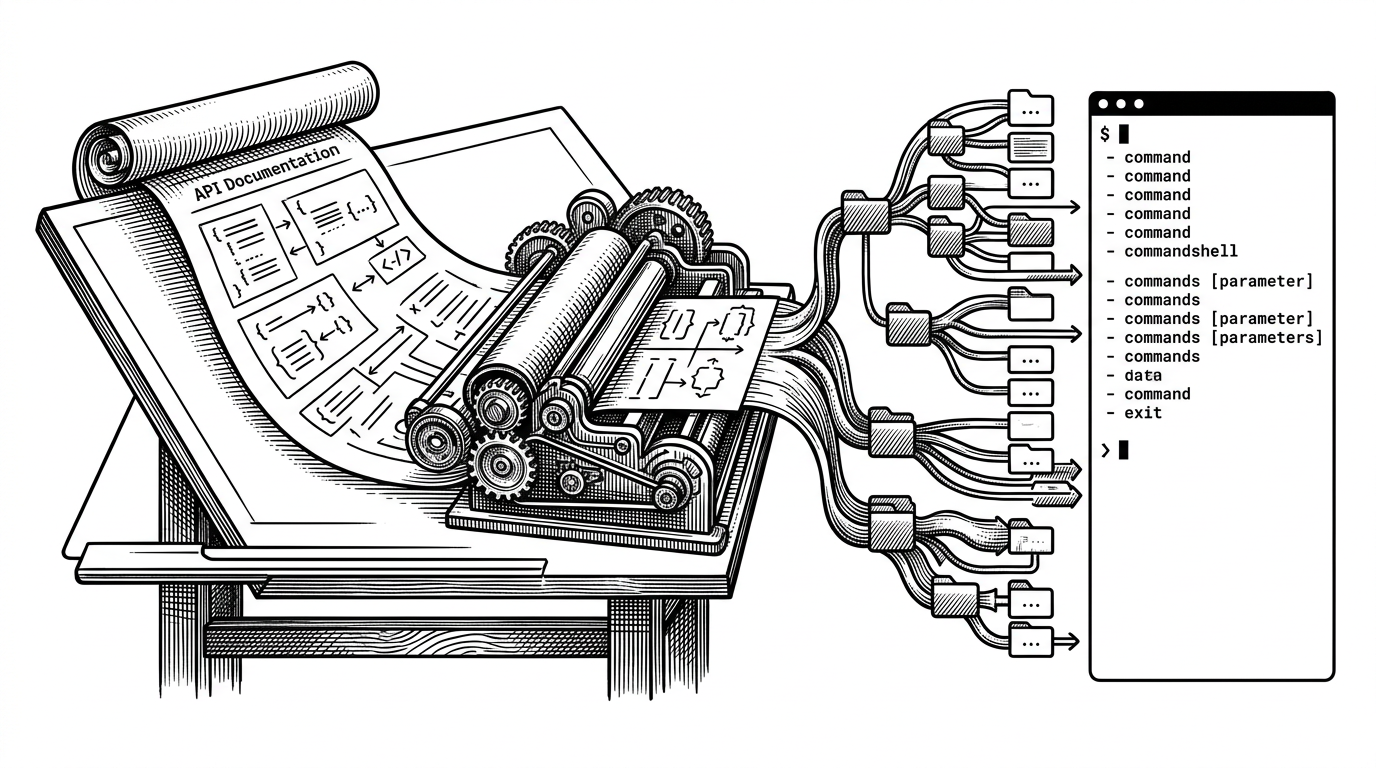
That is the problem CodeBurn attacks. It does not ask your agent to send data somewhere else. It reads the traces already sitting on disk, then turns them into a cost ledger you can inspect locally.
CodeBurn's entire architecture is built around the radical premise that the data already exists on your machine - someone just needed to make it legible.
CodeBurn does not proxy your agents. It reads their footprints.
That distinction matters. Proxy tools sit in the middle of live traffic and measure what passes through. CodeBurn works after the fact. It scans local session artifacts from tools like Claude Code, Cursor, and Codex, then normalizes each tool's oddities into one journal.
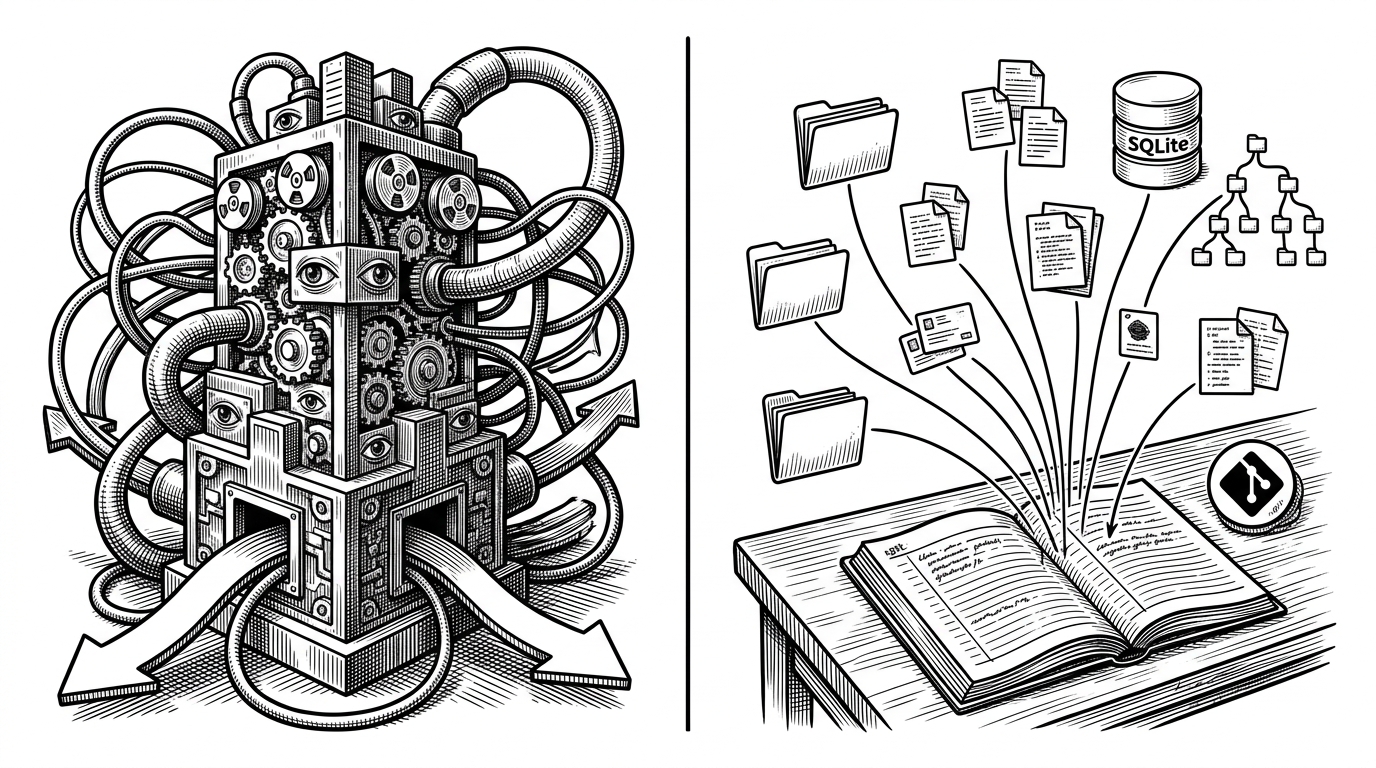
The architectural trick is the parser layer. Each provider gets a dedicated adapter, but the rest of the system wants one shape: a unified entry with time, tokens, cost, task type, and project. That lets the tool compare apples to apples across very different AI products.
How the parser turns chaos into one ledger
The hardest problem is not reading files. It is deciding what belongs together. CodeBurn resolves canonical project paths by walking upward until it finds a .git boundary, which means temporary working directories do not fragment your history into junk buckets.
// Conceptual shape of the normalization flow
const journalEntry = normalize(providerRecord)
const projectRoot = resolveCanonicalProjectPath(entry.cwd)
const bucket = groupBy(projectRoot, journalEntry)

// One ledger, many providers
ledger.push({
  projectRoot,
  provider: journalEntry.provider,
  tokensIn: journalEntry.tokensIn,
  tokensOut: journalEntry.tokensOut,
  cacheRead: journalEntry.cacheRead,
  cacheWrite: journalEntry.cacheWrite,
})
That choice sounds small until you use multiple tools in parallel. A system that groups by raw path will lie to you. A system that groups by canonical project gives you something closer to an accounting statement for a repo.
The pricing engine is where the tool becomes useful
Once the data is normalized, CodeBurn gets practical. It does not just count tokens. It estimates what they cost, keeps a snapshot of model pricing, updates from LiteLLM when it can, and applies cache heuristics when pricing tables are incomplete.
That matters because cost is not just a number. It is a decision signal. If cache writes are expensive, repeated context churn is a tax. If local models are mapped against a paid baseline, you can see what you saved by staying off the API.
// Pricing is a decision layer, not a raw tally
const costs = buildCosts({
  model: entry.model,
  inputTokens: entry.tokensIn,
  outputTokens: entry.tokensOut,
  cacheReadTokens: entry.cacheRead,
  cacheWriteTokens: entry.cacheWrite,
  localModelSavings: entry.localModelSavings,
})

if (costs.projectedMonthly > planThreshold) {
  alert('Near subscription limit')
}
This is also where CodeBurn starts to feel like a spending microscope. The optimize flow can surface waste patterns such as repeated file reads that never hit cache, or conversations that consume budget without producing edits.
The dashboard is the daily operating layer
The terminal interface is not decoration. It is the place where the tool becomes habit. A week-at-a-glance view gives you the essentials fast: spend, tokens, cache hit rate, and whether you are near or over a plan boundary.
That makes CodeBurn useful in a way most analytics tools are not. You can check it while you work, not after the team retro. The focus stays on operational feedback, not abstract reporting.
Where CodeBurn sits in the ecosystem
| Tool | Data source | Privacy model | Provider coverage | Primary UX | Best for | Trade-off |
|---|---|---|---|---|---|---|
| CodeBurn | Local session logs, SQLite, provider files | Local-first forensic read | Multi-provider | TUI, web, macOS, GNOME | Private cost auditing across tools | Not centralized by design |
| ccusage | Claude Code usage logs | Local analysis | Claude-focused | CLI | Quick Claude token accounting | Narrower scope |
| Claude-Code-Usage-Monitor | Usage and plan signals | Local monitoring | Claude-focused | Monitor and alerts | Watching plan limits in real time | Less forensic depth |
| LiteLLM | Proxied API traffic | Centralized proxy | Broad API support | Admin and gateway tooling | Team-wide control and routing | Requires interception |
The comparison is not about declaring a winner. CodeBurn is different in kind. It is built for a developer who wants a private audit trail across multiple coding tools, not an enterprise gateway or a single-product meter.
The bigger category is AI-stack observability
CodeBurn points to a larger shift. As AI assistants become part of everyday development, teams will need the same sort of legibility they already expect from infrastructure monitoring. Not traffic for its own sake. Evidence.
That is the real story here. CodeBurn is a local bill of materials for AI work. It says the filesystem can tell you enough to manage the spend, if you are willing to read it well.