`potato-disease`: The Tiny CNN That Starts With a Leaf and Ends With the Weather
A notebook-built potato disease detector does more than classify spots. It hints at a next step where humidity, temperature, rainfall, and leaf texture all matter.
- `potato-disease` matters because it reaches past leaf classification and hints at an agronomy tool that can combine symptoms with weather context.
- Its six-layer CNN is tuned for fine visual differences, which is exactly what potato disease detection depends on.
- The repo is methodical enough to show a real ML workflow, but still notebook-native and far from production packaging.
- Its value is not that it is finished. Its value is that it shows the shape of precision agriculture before it becomes a product.
The quiet upgrade: this repo is not just reading leaves
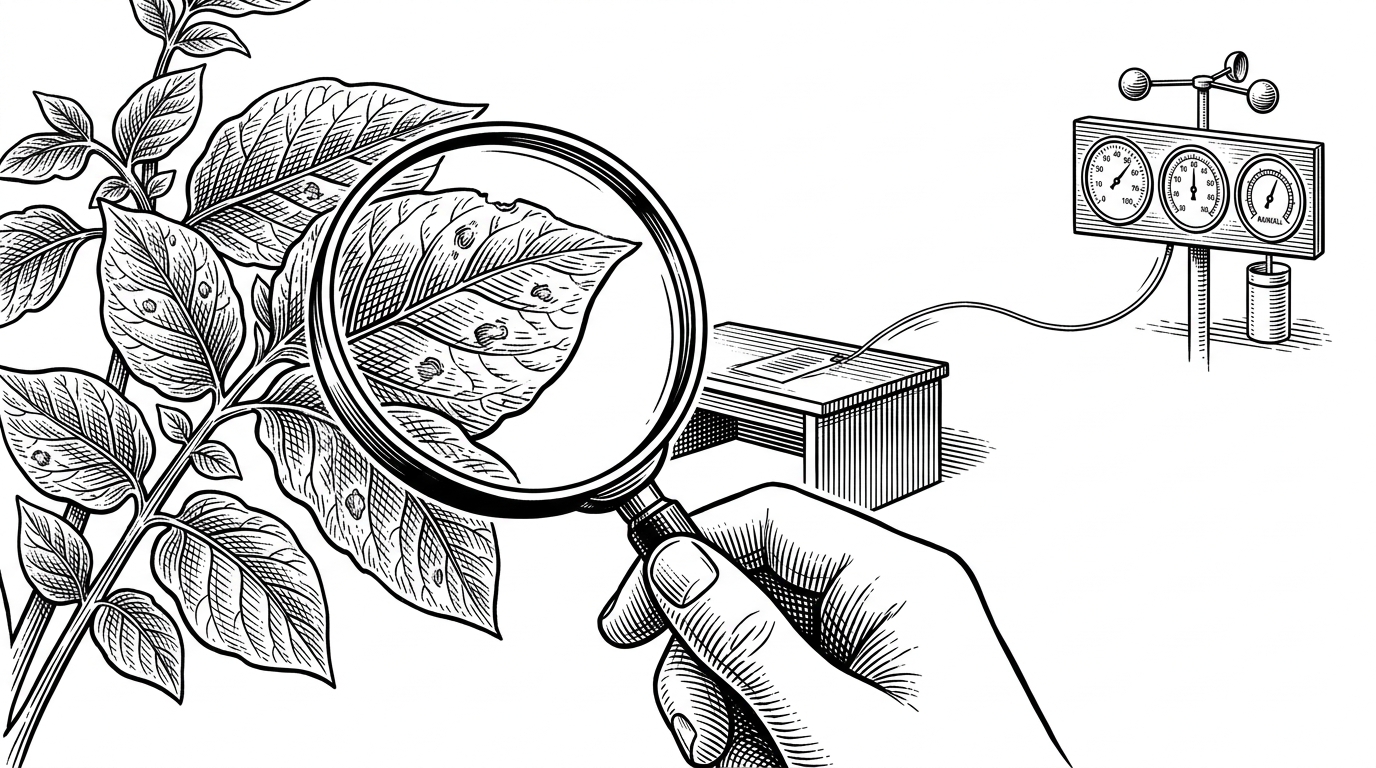
The interesting clue is not the classifier. It is the extra weather data. This repository pulls in weather.csv alongside leaf images, which changes the question from What disease is this? to Why is this disease showing up now?
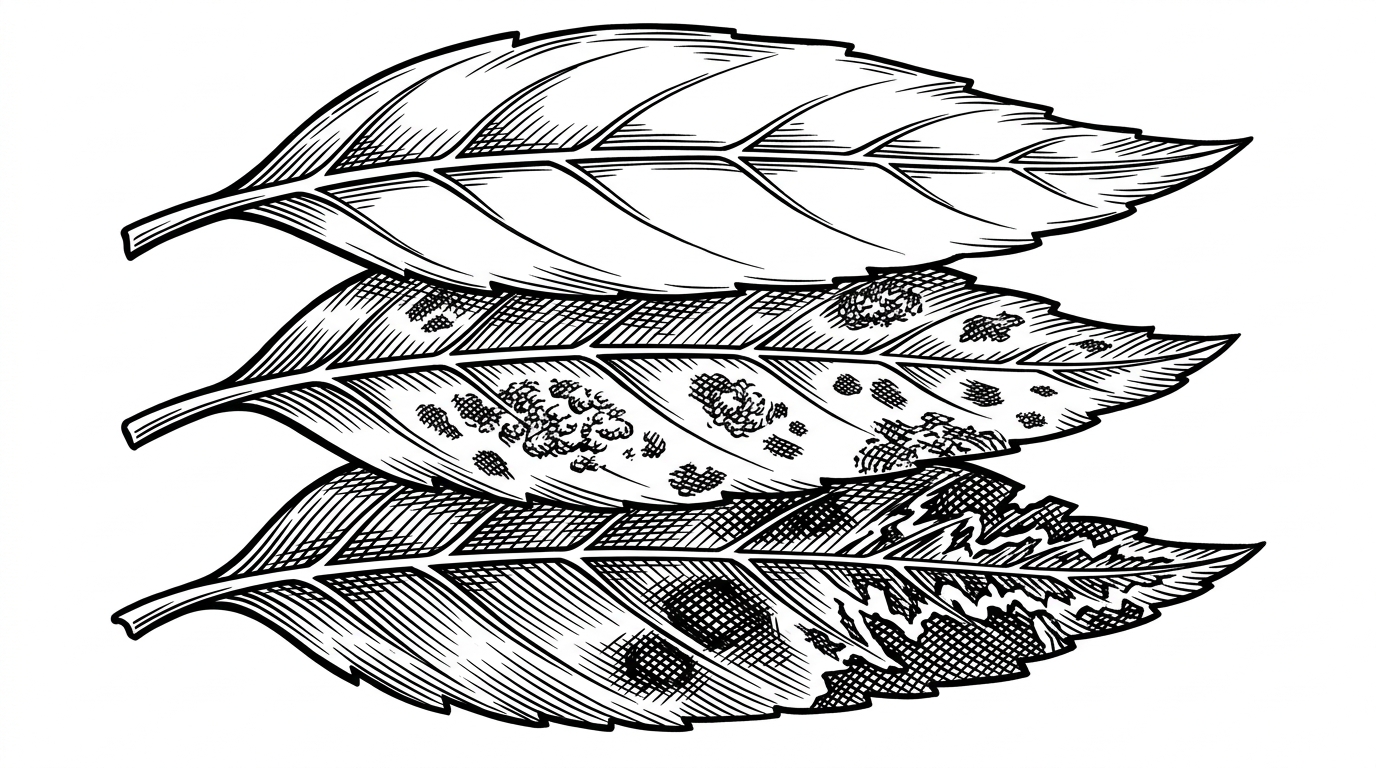
That is a small shift in code and a big shift in intent. A leaf image can identify Early Blight, Late Blight, or Healthy tissue. Weather context suggests a tool that could eventually explain disease pressure, not just label a photo.
Inside the classifier: six convolutional layers for tiny visual differences
This is a standard Keras workflow, but it is not a toy model. The notebooks use ImageDataGenerator for rescaling and light augmentation, including flips and small rotations. That matters because plant images are rarely perfectly framed, and disease signals often survive only if the model learns to ignore orientation noise.
The architecture stacks six Conv2D layers, each followed by pooling, then a flattening stage, a dense hidden layer, and a three-way softmax output. That depth is a deliberate choice for a problem where the difference between classes can be a ring pattern, a lesion edge, or a texture change no larger than a fingertip.
model = Sequential([
    layers.InputLayer(input_shape=(256, 256, 3)),
    layers.Rescaling(1.0 / 255),
    layers.Conv2D(32, 3, activation='relu'),
    layers.MaxPooling2D(),
    layers.Conv2D(32, 3, activation='relu'),
    layers.MaxPooling2D(),
    layers.Conv2D(64, 3, activation='relu'),
    layers.MaxPooling2D(),
    layers.Conv2D(64, 3, activation='relu'),
    layers.MaxPooling2D(),
    layers.Conv2D(64, 3, activation='relu'),
    layers.MaxPooling2D(),
    layers.Conv2D(64, 3, activation='relu'),
    layers.MaxPooling2D(),
    layers.Flatten(),
    layers.Dense(64, activation='relu'),
    layers.Dense(3, activation='softmax')
])| Stage | What it sees | Why it matters |
|---|---|---|
| First conv blocks | Edges, veins, coarse contrast | These layers learn the basic geometry of a leaf. |
| Middle conv blocks | Spots, blotches, repeated textures | These layers separate disease patterns from healthy tissue. |
| Final conv blocks | Lesion structure and local texture combinations | These layers push the model toward a class decision. |
| Dense + softmax | Compressed features | These layers turn visual evidence into one of three labels. |
Why the dataset structure matters more than it looks
The folder layout tells you a lot about the project’s maturity. There are separate train, test, and val directories, plus an Aug/ folder for expanded samples. That is the shape of a serious experiment, even if the code still lives mostly in notebooks.
It also suggests a practical mindset. The builder is not inventing a custom data pipeline from scratch. They are using a standard image classification workflow, which is exactly what you want when the real challenge is not infrastructure but signal quality.
| Project shape | Data handling | What it implies |
|---|---|---|
| Notebook-first repo | Training and evaluation live in Jupyter notebooks | Fast to iterate, easy to inspect, hard to package. |
| Structured dataset folders | Train, validation, and test splits are explicit | The workflow is methodical, not improvised. |
| Offline augmentation folder | Extra samples are prebuilt and stored | The project cares about robustness, but still feels experimental. |
| Simple inference path | A basic API layer exists alongside training | This is already more than a class demo, but not yet a product. |
What this repo gets right, and what it is still missing
The strongest thing here is focus. This repo takes a single disease-detection problem and follows it through data preparation, augmentation, training, and a path to inference. That makes it easy to study and easy to extend.
The gaps are just as informative. The project has default notebook names, little modular structure, no polished product layer, and no strong public-facing documentation. That does not make it weak. It makes it legible as an early prototype.
| Area | What exists | What is missing |
|---|---|---|
| Modeling | A real CNN with augmentation and a three-class output | Nothing major in core approach. |
| Packaging | Training logic and inference plumbing are present | No clear module boundary or clean app structure. |
| Documentation | Enough code to inspect the workflow | No mature README or developer guide. |
| Project polish | Functional and reproducible in notebook form | Not yet ready to feel like a durable library or product. |
How it compares to the usual potato CNN demo
Most tutorial repos stop at classification. They show that a CNN can separate healthy from diseased leaves, then leave it there. This repo goes a little further by pairing the image workflow with weather data and a simple API path.
That puts it in an interesting middle. It is smaller than a production agronomy platform, but more ambitious than a throwaway notebook. The project is useful because it shows the full shape of the problem without hiding behind scale.
| Dimension | `potato-disease` | Typical tutorial CNN repo | Production agronomy platform |
|---|---|---|---|
| Purpose | Single-crop disease detection with a hint of context | Demonstrate image classification | Support field decisions at scale |
| Model complexity | Custom multi-layer CNN | Shallow or standard CNN | Often ensembles or heavily tuned models |
| Data sources | Leaf images plus weather.csv | Leaf images only | Multi-source, often proprietary |
| Deployment | Notebook training plus simple API path | Usually no deployment | Mobile, cloud, or edge workflows |
| Decision scope | What disease is visible, and maybe why | What class is in the image | What action should a grower take |
The larger lesson: precision agriculture starts as a notebook
This repo is small, but it points at a real pattern. Open datasets, standard CNNs, and lightweight APIs let one developer build the first version of a tool that feels much bigger than the codebase.
That is how a lot of useful software starts. Not with a platform, but with a notebook that asks a better question than the obvious one. Here, the better question is not just what the leaf looks like. It is what the weather made possible.