Maharashtra_Climate_Change: How One Dashboard Turns 51 Years of Monsoon Data into a Readable Regional Story
A Power BI and Python pipeline converts IMD gridded climate records into district-level trends, seasonal comparisons, and deviation analysis for Maharashtra.
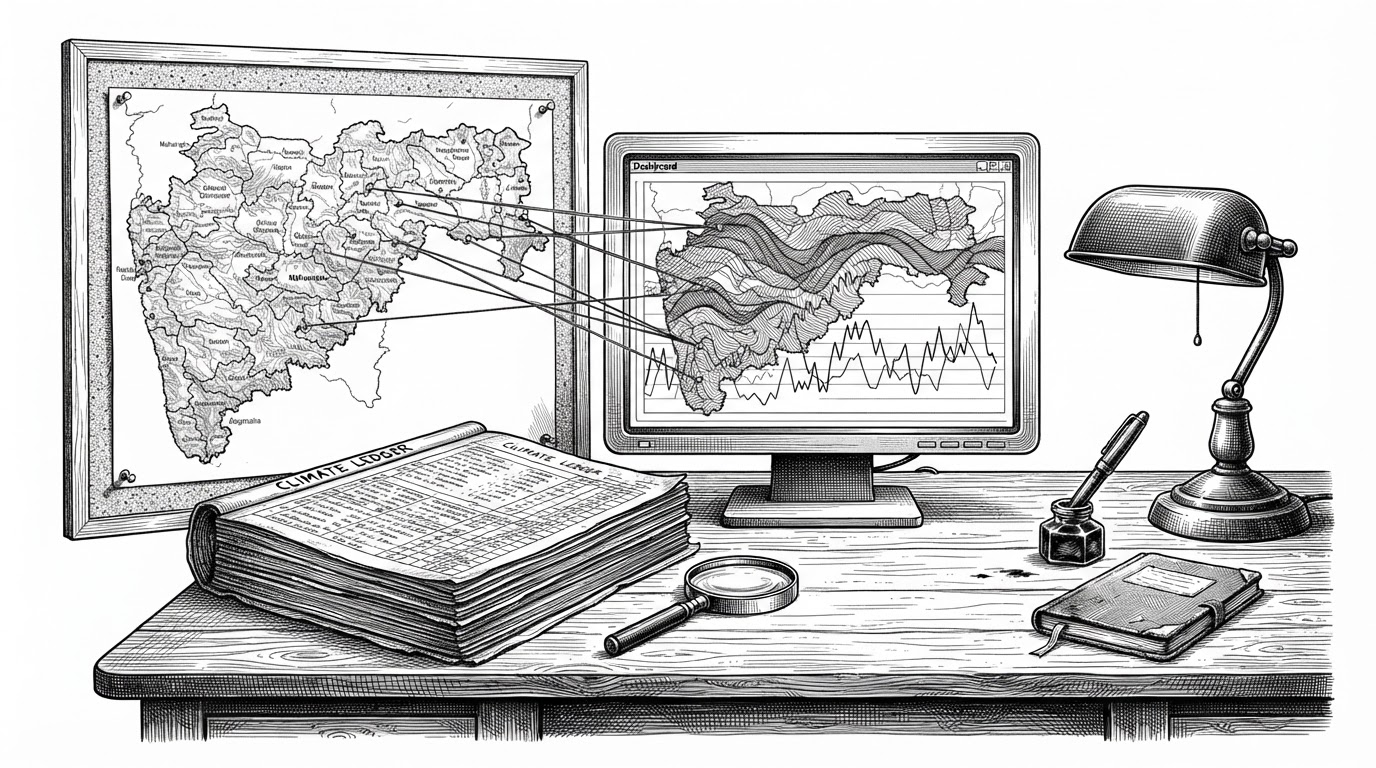
- The repo’s real achievement is not a dashboard, but a translation layer that turns IMD climate grids into district-level analysis.
- Its data model matters as much as its charts, because the CSV lookup tables and Power BI relationships make the climate story usable.
- The project chooses practicality over geographic perfection by using district coordinates instead of full polygon averaging.
- This is a descriptive climate tool, not a forecasting system, and that distinction shapes every design choice.
Why this repo is interesting
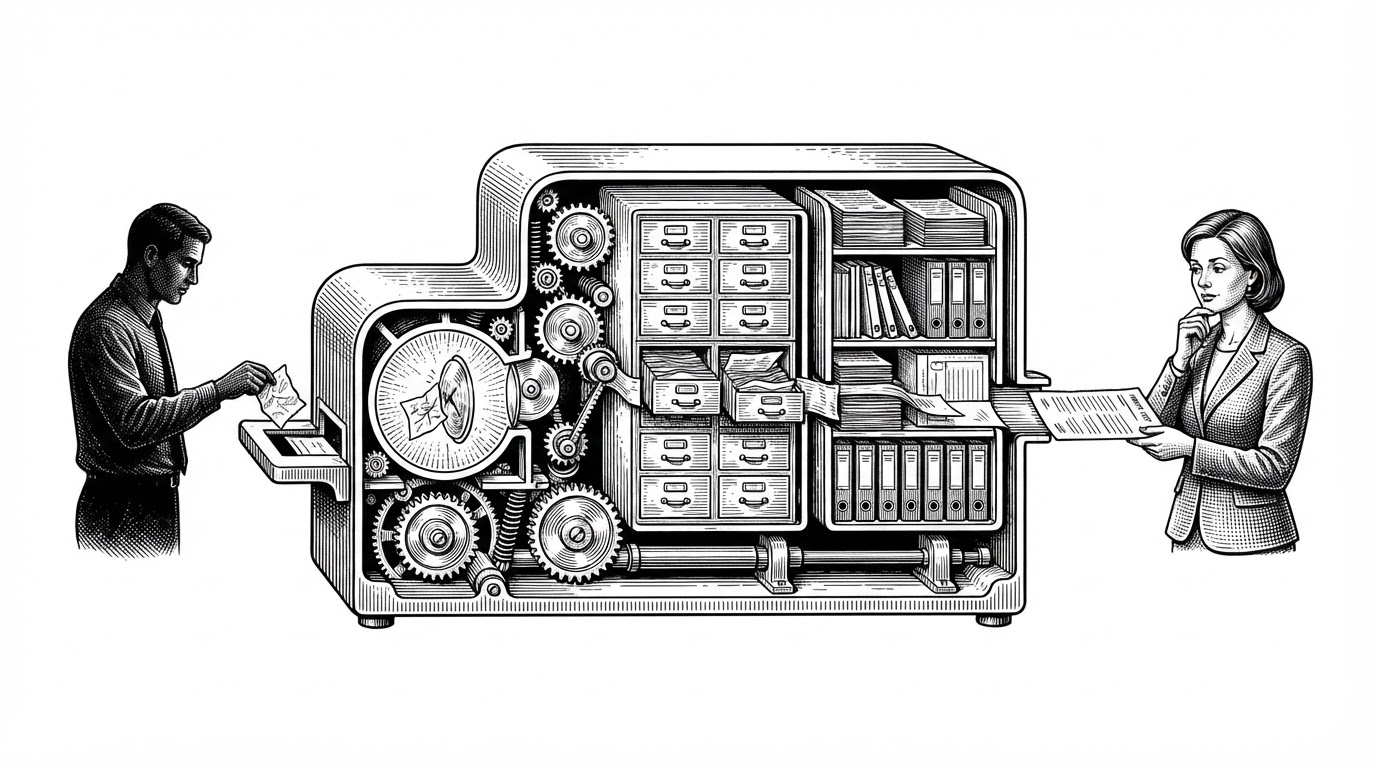
Most climate data is technically rich and operationally awkward. Maharashtra_Climate_Change is compelling because it takes 51 years of rainfall and temperature records from the India Meteorological Department and turns them into something a district-level reader can actually use.
That is the real story here. The repo is not trying to impress you with a model. It is trying to make regional climate history legible, one coordinate, one table, and one Power BI relationship at a time.
From gridded climate data to local districts
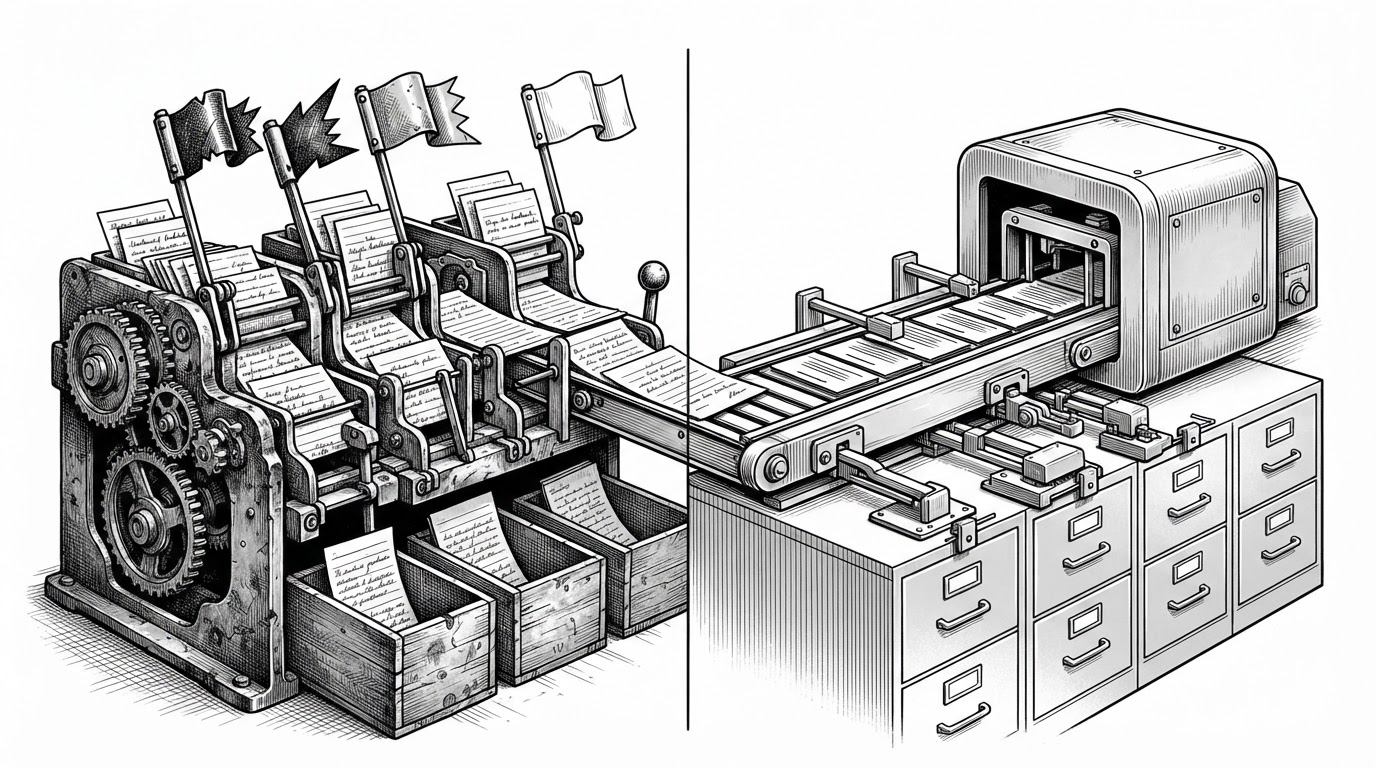
The pipeline starts in Python, using IMD gridded data for rainfall, minimum temperature, and maximum temperature. A Jupyter notebook in Google Colab fetches the data year by year, then maps it to a curated district coordinate list before exporting CSVs for the dashboard layer.
That design is practical, but it is not neutral. The notebook uses point coordinates for districts rather than averaging full district polygons, which keeps the workflow simple and portable, but introduces a precision tradeoff for larger or more irregular districts.
The schema that makes the dashboard usable
The hidden backbone of the project is not the charting layer. It is the lookup structure. index 1.csv maps districts to subdivisions, while index 2.csv maps months to Indian seasons.
That sounds small, but it is what lets the dashboard speak a policy-friendly language. Maharashtra’s climate is not just a list of years and rainfall totals. It is a repeatable schema for asking which subdivision changed, which season shifted, and where the pattern shows up.

What the dashboard actually measures
The Power BI layer is built around historical comparison, not prediction. It uses Long Period Average, year-over-year deviation, and categorical framing like Excess, Normal, and Deficient to make climate variability easy to scan.
| Concept | What it does | Why it matters |
|---|---|---|
| Long Period Average | Compares a year against the 51-year baseline | Turns long history into a single reference point |
| Deviation analysis | Measures how far a year sits above or below average | Makes anomalies visible without a forecasting model |
| Excess / Normal / Deficient | Classifies rainfall outcomes into readable buckets | Lets non-specialists interpret climate change patterns fast |
That matters because the repo is not pretending to forecast the monsoon. It is building a historical lens for pattern recognition, which is often the more useful job in regional decision-making.
The tradeoff that shapes the whole project
The most interesting technical choice is also the most debatable one: using district-center coordinates instead of full district polygons. It makes the pipeline lighter, the notebook easier to maintain, and the Power BI model easier to reuse.
But it also means the project is choosing operational clarity over geographic exactness. For exploratory analysis, that can be the right tradeoff. For boundary-sensitive studies, it would not be enough.
How it compares to other Maharashtra climate projects
| Project | Goal | Data posture | Output | Audience |
|---|---|---|---|---|
| Maharashtra_Climate_Change | Translate IMD climate history into district-level insight | Descriptive and accessibility-first | Power BI dashboard with seasonal and deviation analysis | Researchers, policy readers, and technically curious generalists |
| abhi-deshpande/maha-climate | Analyze long-term atmospheric trends in Maharashtra | Descriptive with stronger method framing | Power BI-based climate analysis | Data-savvy readers and climate analysts |
| Institutional climate planning tools | Optimize adaptation or energy pathways | Predictive or prescriptive | Models, scenarios, and policy outputs | Government and program teams |
The important distinction is not feature count. It is purpose. This repo sits at the accessibility end of the spectrum, where the job is to make climate history readable before it becomes optimizable.
Who built it and what that tells us
Maha Climate is a Power BI project analyzing 51 years of rainfall and temperature data in Maharashtra. It explores monsoon trends, seasonal patterns, and climate change indicators using IMD data
That framing fits the repo well. It reads like a serious educational or portfolio artifact, built by someone who cares about the mechanics of data shaping as much as the final visual.
If there is a bigger lesson here, it is that regional climate intelligence rarely begins with sophistication. It begins with discipline: clean lookup tables, sensible mappings, and a dashboard that tells the truth in plain sight.
What this project proves
Maharashtra_Climate_Change shows that useful climate analysis does not require a huge platform. A careful pipeline, a practical schema, and a clear visual model can turn noisy environmental data into something that actually helps people think.
That is a useful reminder for anyone building analytical tools in public. The hardest part is often not the chart. It is the translation.