Smart-Waste-Management-System-DataAnalysis: Smart Waste Management System: When Trash Becomes a Routing Problem
A university-built IoT data stack that scores bin urgency in real time, recalculates collection routes, and monitors whether vehicles stay on task.
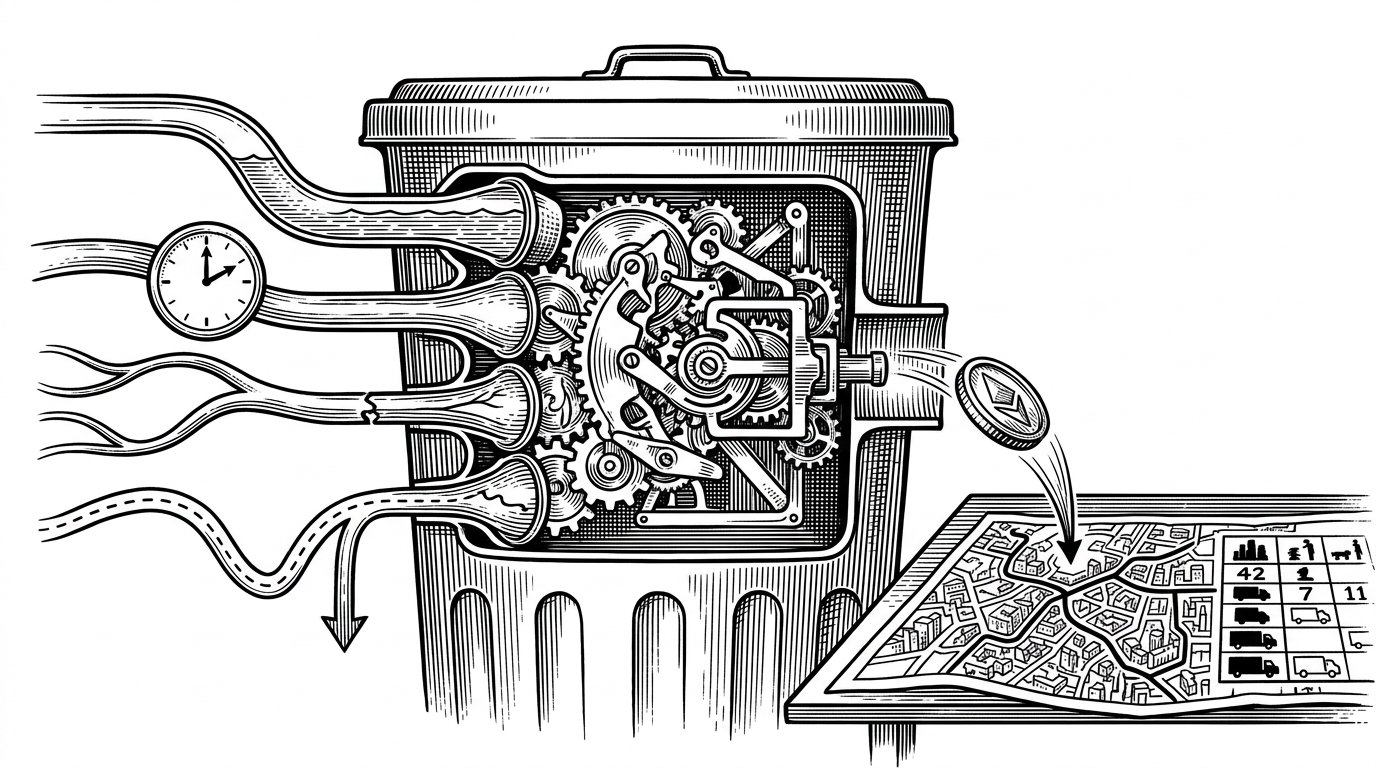
- This repository treats waste as a live prioritization problem, not a simple threshold alert.
- Its urgency score combines fill state, prediction, time since collection, and distance cost into one dispatch signal.
- The route planner and vehicle deviation monitor turn that signal into a closed operational loop, not just a report.
- The stack feels more like a miniature city operations backend than a typical student dashboard.
Most waste-monitoring projects stop at the alert. This one keeps going. It scores bins, reshapes routes, and then checks whether the trucks actually follow the plan.
The bin is not the unit. The decision is.
The important design choice in this repository is that a bin is never treated as a yes-or-no event. A bin becomes a decision candidate, scored against urgency and operational cost. That is why a 60 percent full bin can outrank an 80 percent full one if it is filling fast, sits far from the depot, or has waited too long since collection.
That framing matters because it changes the output of the system. Instead of flooding operators with raw telemetry, the pipeline emits a ranked work list. In other words, the data model is not centered on sensing. It is centered on dispatch.
How the urgency score thinks
The real engine lives in the telemetry processor. According to the repository analysis, `bin_telemetry.py` computes a weighted priority score from multiple inputs: fill level, predicted fill, time since collection, distance cost, and risk factor. The point is not mathematical elegance. The point is better triage.
priority_score = (
    w_fill * fill_level_pct +
    w_predicted * predicted_fill_pct +
    w_time * time_since_collection_hours +
    w_distance * distance_cost +
    w_risk * risk_factor
)

if priority_score >= URGENT_THRESHOLD:
    status = "Urgent"
else:
    status = "Normal"
That kind of heuristic is useful because it gives the system a memory of context. A static threshold only tells you whether something crossed a line. A weighted score tells you what deserves attention first. For operations, that difference is huge.
The best way to read the diagram is as a control system. A bin emits a signal. The processor scores it. The database preserves the hot state. The optimizer reacts. Then the compliance layer watches execution. That is the whole loop, and that loop is the product.
From Kafka ping to route_plan
The data path is deliberately layered. Kafka carries telemetry into the Flink processor. Flink updates hot state in PostgreSQL through `bin_current_state`. The route optimizer reads that state and writes a `route_plan`, often as JSONB waypoints. InfluxDB keeps the raw time-series trail for later analysis.
| Layer | What it stores | Why it matters |
|---|---|---|
| Kafka + Flink | Live telemetry and processor output | Keeps the system reactive. |
| PostgreSQL `bin_current_state` | Current urgency and predicted full time | Gives the optimizer a fast source of truth. |
| PostgreSQL `route_plans` | JSONB waypoints and planned stops | Lets the system hand off work to drivers and downstream tools. |
| InfluxDB | Historical telemetry | Preserves the long tail of sensor behavior for analysis. |
That separation is the right instinct. Relational tables handle the current state and the plan. Time-series storage handles history. The result feels less like a demo and more like a real operations stack, even if the project is still clearly an academic prototype.
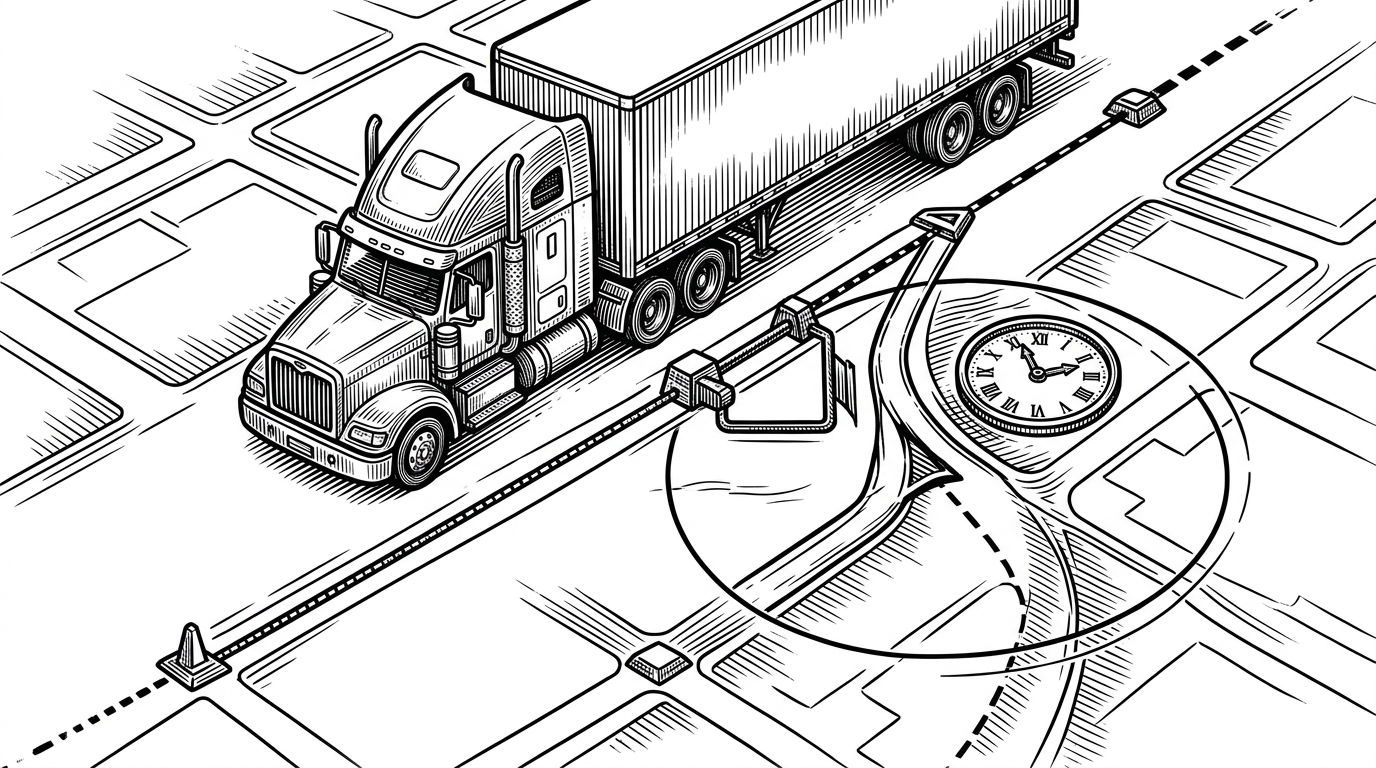
The compliance layer changes the meaning of the system
`vehicle_deviation.py` is the twist. It uses the Haversine formula to compare a vehicle’s GPS ping with its assigned route waypoints. If the truck stays beyond the deviation threshold for long enough, the system does not just notice. It alerts.
That matters because it upgrades the repository from routing assistance to accountability infrastructure. A normal route optimizer tries to help a driver get from A to B. This one also checks whether the driver is still on A to B after the handoff. That is a much stronger operational claim.
Why this stack feels more like a city backend than a class project
The stack is broad on purpose: Flink, Kafka, FastAPI, OR-Tools, Airflow, Spark, MLflow, PostgreSQL, InfluxDB, and Docker Compose. That is a lot for one repository, but it is also the point. The project is trying to model the layers you would expect in a serious data platform, even if the deployment scale is still small.
| Dimension | This repository | Simple bin-threshold system | Platform-led IoT stack |
|---|---|---|---|
| Urgency model | Weighted score with prediction and context | Single fill threshold | Context-aware scoring plus rules |
| Routing | Reactive route planning | Usually absent | Supported by broader tooling |
| Compliance monitoring | Vehicle deviation detection | Usually absent | Possible but often separate |
| Data storage | PostgreSQL + InfluxDB | One database or spreadsheet | Polyglot persistence |
| Maturity | Functional academic prototype | Toy demo | Production-grade platform |
That is the right way to place it. It is narrower than ThingsBoard or FIWARE, but more opinionated about operations than a generic dashboard project. It is a working idea of how a municipal waste backend could behave if the city treated trash collection as a live optimization problem.
What this project gets right, and where it stops
The strongest thing here is not the stack list. It is the coherence between parts. The telemetry model feeds the scoring model. The scoring model feeds routing. The route model feeds compliance. That chain is unusually complete for a student project.
The limits are also clear. This is still a prototype, not a deployed city service. It does not prove field reliability, device security, or municipal integration. But it does show good systems thinking, and that is rarer than a flashy dashboard.
In that sense, the repository succeeds as both an engineering exercise and an editorial artifact. It shows that garbage collection can be treated as a real-time decisions problem, not just a logistics chore.