react-scan: React Scan and the Art of Invisible Instrumentation
How a high-performance "ghost" layer hijacks the React Fiber tree to make internal slowness impossible to ignore.
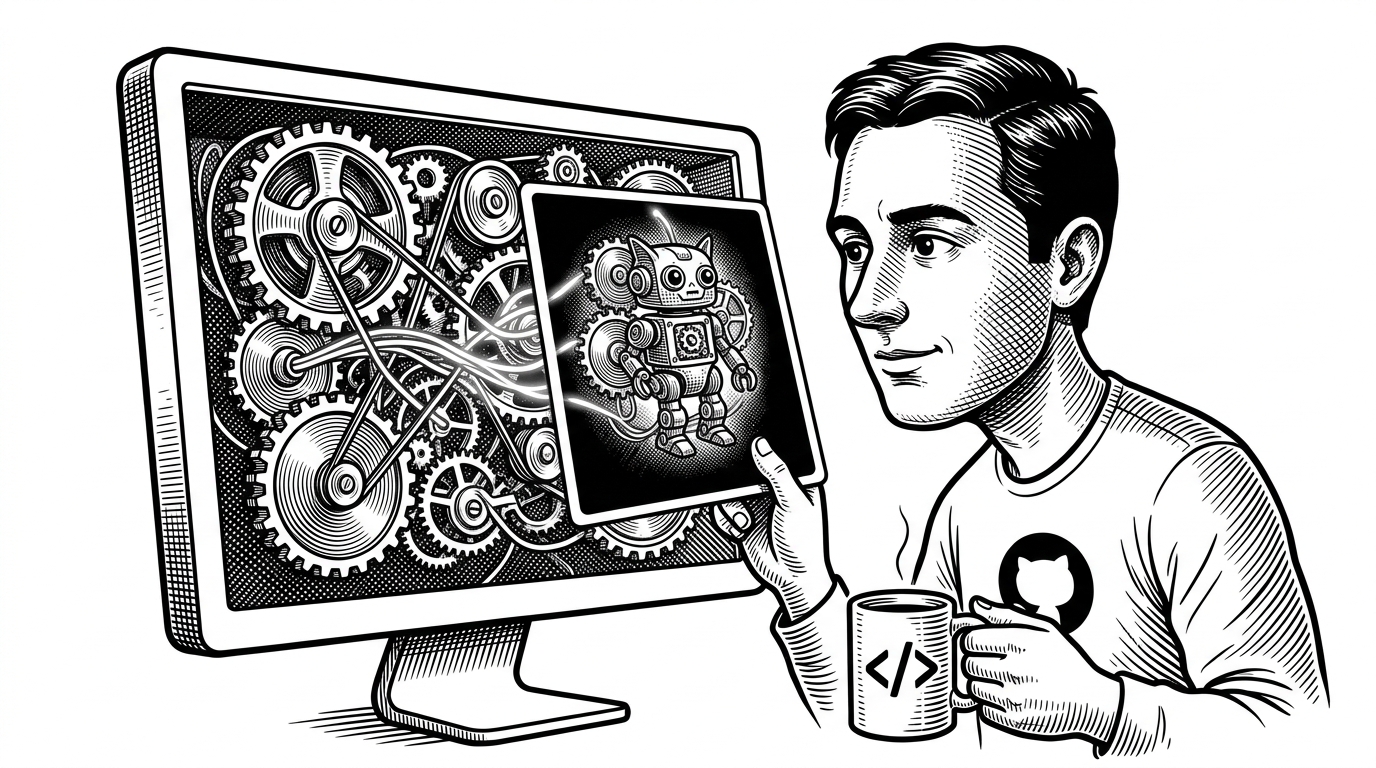
- The tool hijacks the React DevTools global hook to intercept the Fiber tree's commit phase without requiring source code changes.
- Offloading visualization to a Web Worker via OffscreenCanvas prevents the monitoring tool from slowing down the application's main thread.
- A custom serialization utility identifies unnecessary renders by detecting when props change by reference but not by value.
- Visual overlays and auditory pings transform abstract performance metrics into immediate sensory feedback for developers.
Seeing the Invisible
Most React performance tuning is a post-mortem activity. A user complains about lag, an engineer opens a profiler, records a session, and squints at a flame graph to find the culprit. It is a reactive process divorced from the act of writing code.
React Scan changes this paradigm by turning performance debugging into a sensory, always-on experience. By injecting a lightweight script, developers immediately see flashing outlines around components as they re-render in the browser. It even includes auditory "pings" using the Web Audio API to alert developers to render storms. It transforms performance from an abstract metric into an immediate, physical sensation.
Sure, React DevTools exist for debugging performance, but let’s be honest—they’re either too complex or not intuitive enough when it comes to pinpointing render issues. That’s where React Scan shines. It simplifies the process of identifying unnecessary renders and performance bottlenecks in your React code, helping you find performance issues.
Hijacking the DevTools Hook
To visualize renders without requiring code changes, React Scan performs a clever heist. It searches the global environment for __REACT_DEVTOOLS_GLOBAL_HOOK__, a backdoor left open by the React team for their official extension.
By hooking into onCommitFiberRoot, the core engine intercepts React's internal commit phase. It leverages a low-level utility called bippy to traverse the React Fiber tree, extracting component names, props, and state. This "god mode" access allows React Scan to know exactly what changed and why, moments before the browser paints the screen.
Solving the Observer Effect
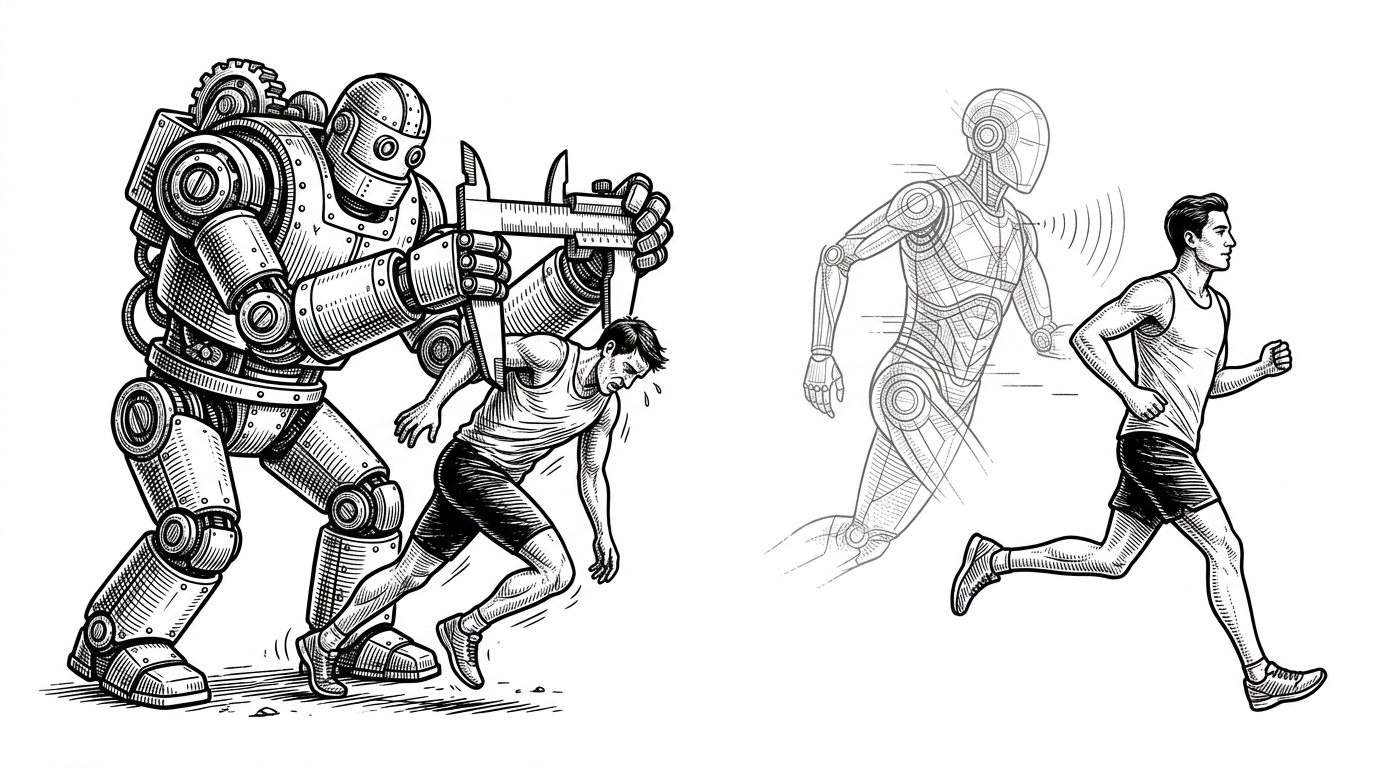
Building a performance monitor introduces a paradox: the tool itself takes up processing power, potentially slowing down the very app it is trying to measure. This is the Observer Effect of front-end engineering.
React Scan solves this by aggressively offloading its visualization layer. Instead of injecting thousands of DOM nodes to draw outlines, it uses a single global `
The Reference Trap
React's default behavior is to re-render a component if its props change. However, React compares objects by reference (using Object.is). If a parent passes a newly created object to a child, React triggers a re-render even if the object's contents are identical.
React Scan exposes this "Reference Trap" using a custom utility called fastSerialize. When an update occurs, it quickly compares the previous and current props by value. If the values match but the references differ, React Scan flags the render as "unnecessary," highlighting exactly where memoization (like useMemo) is missing.
The New Standard for Observability
React Scan does not replace the official React DevTools profiler for deep, post-mortem analysis. Instead, it serves as a "linter for the eyes." It is a zero-configuration observability layer that makes ignoring performance issues practically impossible.
| Feature | React Scan | React DevTools | Why Did You Render |
|---|---|---|---|
| Setup Time | Zero (Script tag) | Low (Browser Extension) | High (Manual config) |
| Feedback Loop | Real-time visual overlays | Record and analyze trace | Console logs |
| Overhead | Near-zero (Web Workers) | Moderate | High (Monkey-patching) |
| Primary Use Case | Proactive, always-on monitoring | Deep-dive post-mortem profiling | Debugging specific components |