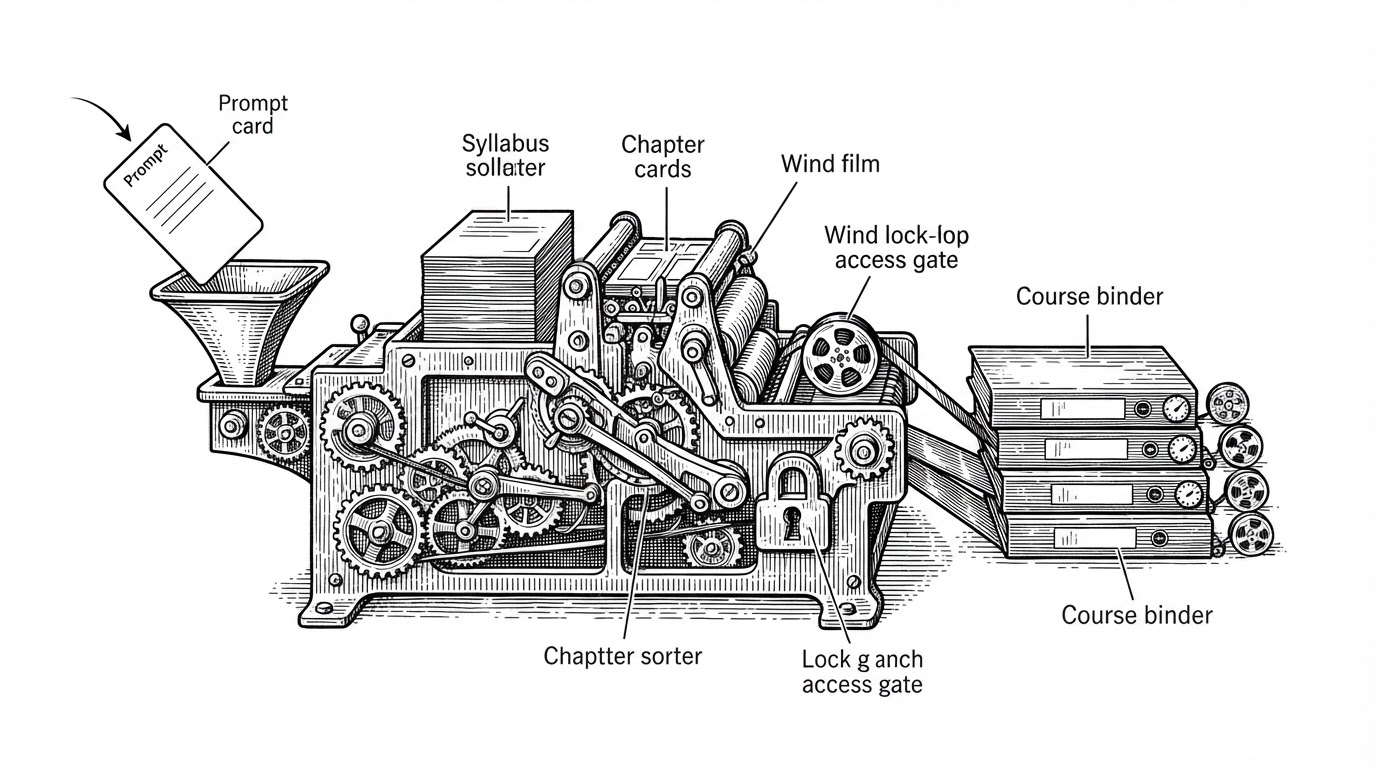
Smart-Factory-Insights: The 7-Day Warning System Hidden Inside an Industrial IoT Pipeline
From Spark preprocessing to XGBoost predictions and operator-facing dashboards, this repo turns sensor noise into a maintenance decision the factory can use.
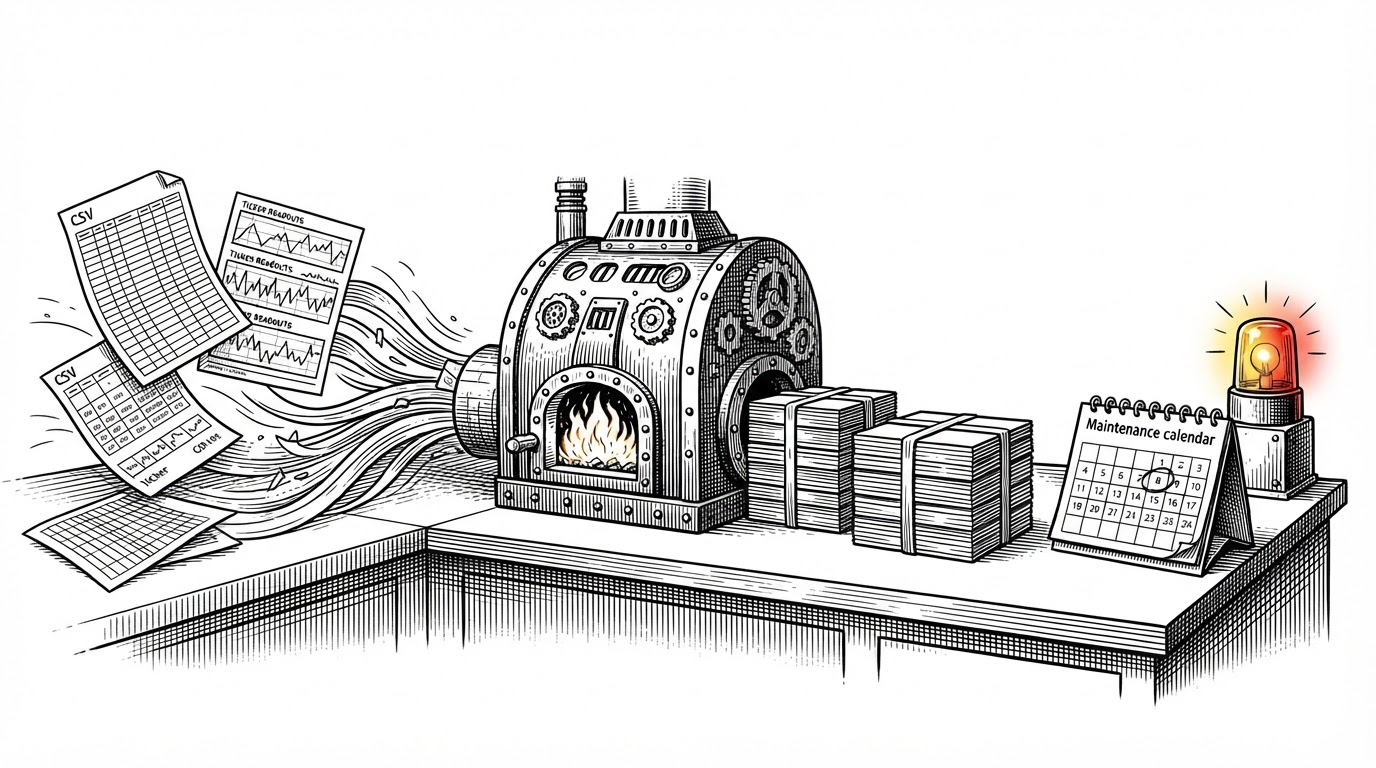
- Smart-Factory-Insights is really a deadline engine, because it turns noisy factory telemetry into a seven-day maintenance window operators can act on.
- The repo’s strongest design choice is the split between failure classification and remaining useful life regression, which gives the same machine two complementary views of risk.
- Spark on Colab is a portability tradeoff that favors reproducibility and access over distributed scale.
- The UI and Tableau layer matter because the project is built to support decisions, not just produce predictions.
The real product is a deadline
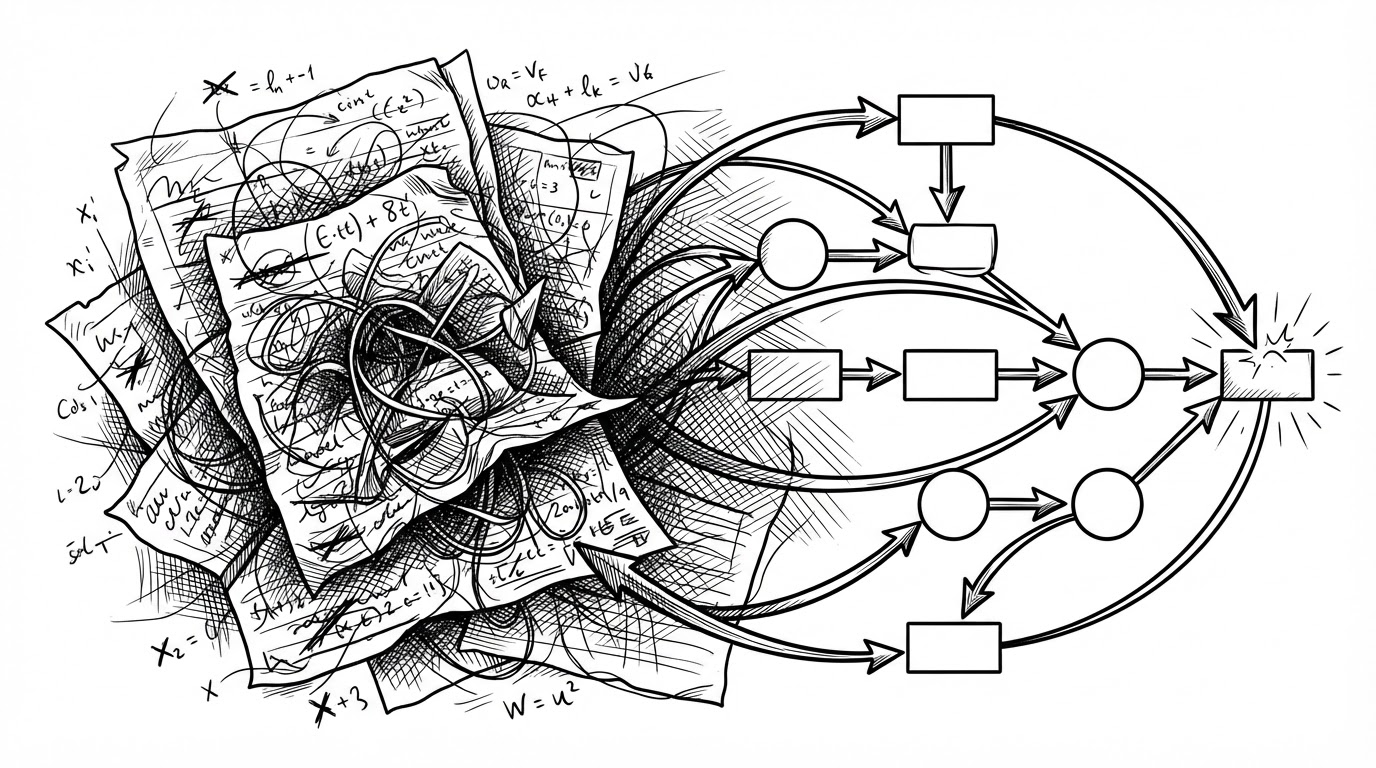
Most predictive maintenance demos stop at a score. This one tries to do something more useful: tell a maintenance team when to act. The repo’s defining move is a 7-day warning window, which turns model output into a scheduling problem instead of a curiosity.
That is why the project feels different from a generic industrial dashboard. It is not asking, “Will this machine fail?” in the abstract. It is asking whether the answer arrives early enough to order parts, plan downtime, and avoid a surprise stop.
56% less value than predicted. That is what the average large technology project delivers. The promise is rarely the problem. The delivery is. What great delivery means, the economics behind it, and 11 disciplines to get it right, including AI at scale. https://t.co/qpgNnni51f
Why 7 days is the sweet spot
A warning horizon is always a tradeoff. Too early, and the signal becomes expensive noise. Too late, and the plant has no time to intervene.
| Generic predictive maintenance | Smart-Factory-Insights |
|---|---|
| Predicts failure someday | Predicts failure within 7 days |
| Single model output | Binary classification plus RUL regression |
| Raw score for analysts | Actionable warning for operators |
| Generic dashboard pattern | Custom UI plus Tableau |
| Notebook workflow tied to one environment | Spark preprocessing in Colab for easier reproduction |
That seven-day band is the editorial center of the repo. It is just specific enough to be operational, but not so narrow that it turns into guesswork.
From raw telemetry to training data
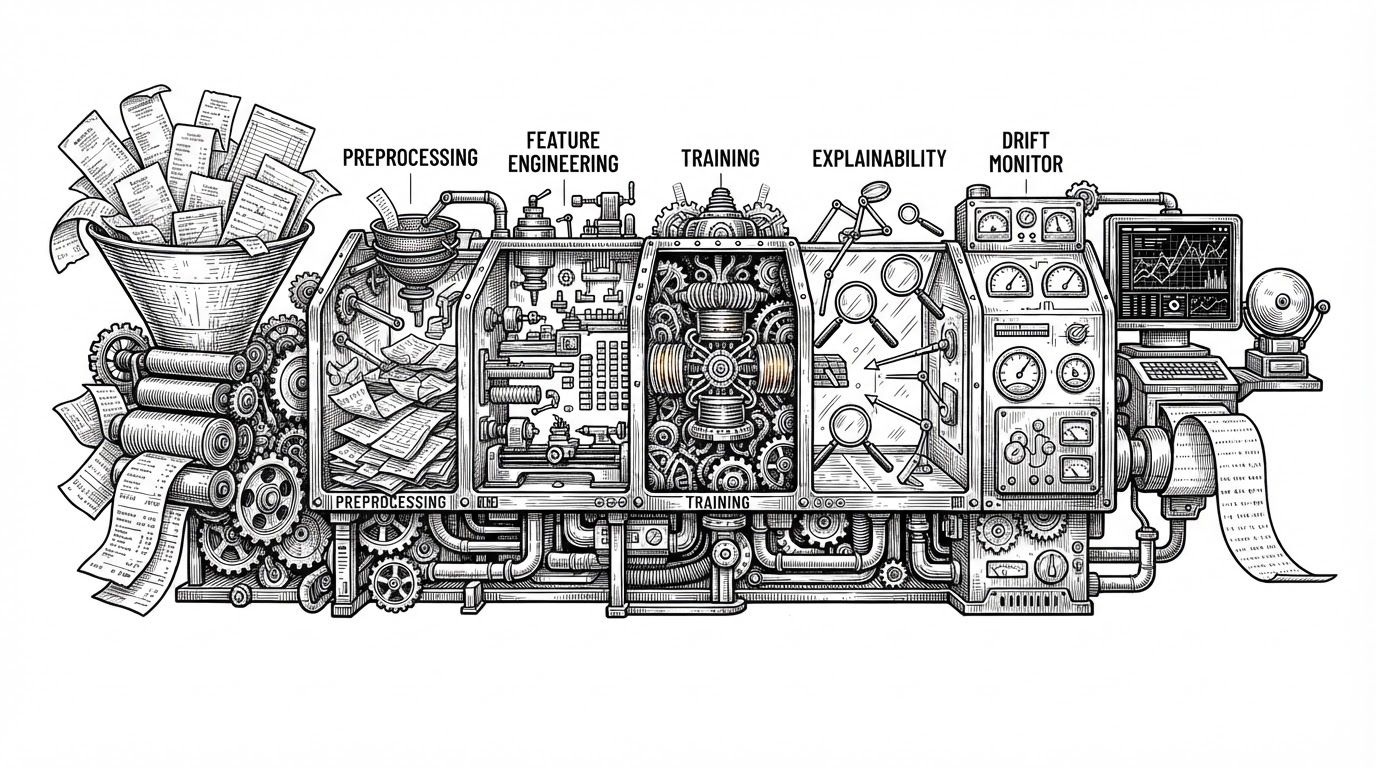
The heavy lift lives in Spark_Preprocessing.ipynb. The notebook installs its own Spark runtime in Google Colab, pulls in raw CSV sensor data, defines schemas, and prepares a feature table for modeling. That choice matters: it makes a big-data style workflow runnable without a dedicated cluster.
Spark is not here because the repo is pretending to be a Hadoop platform. It is here because sensor data gets messy fast, and the preprocessing step needs to feel like industrial ETL instead of a notebook toy.
# Representative setup pattern from the preprocessing notebook
!apt-get install -y openjdk-8-jdk-headless
!wget -q https://downloads.apache.org/spark/spark-3.2.1/spark-3.2.1-bin-hadoop3.2.tgz
!tar -xzf spark-3.2.1-bin-hadoop3.2.tgz

from pyspark.sql import SparkSession
spark = SparkSession.builder.master('local[*]').appName('SmartFactoryInsights').getOrCreate()
Two models, one decision
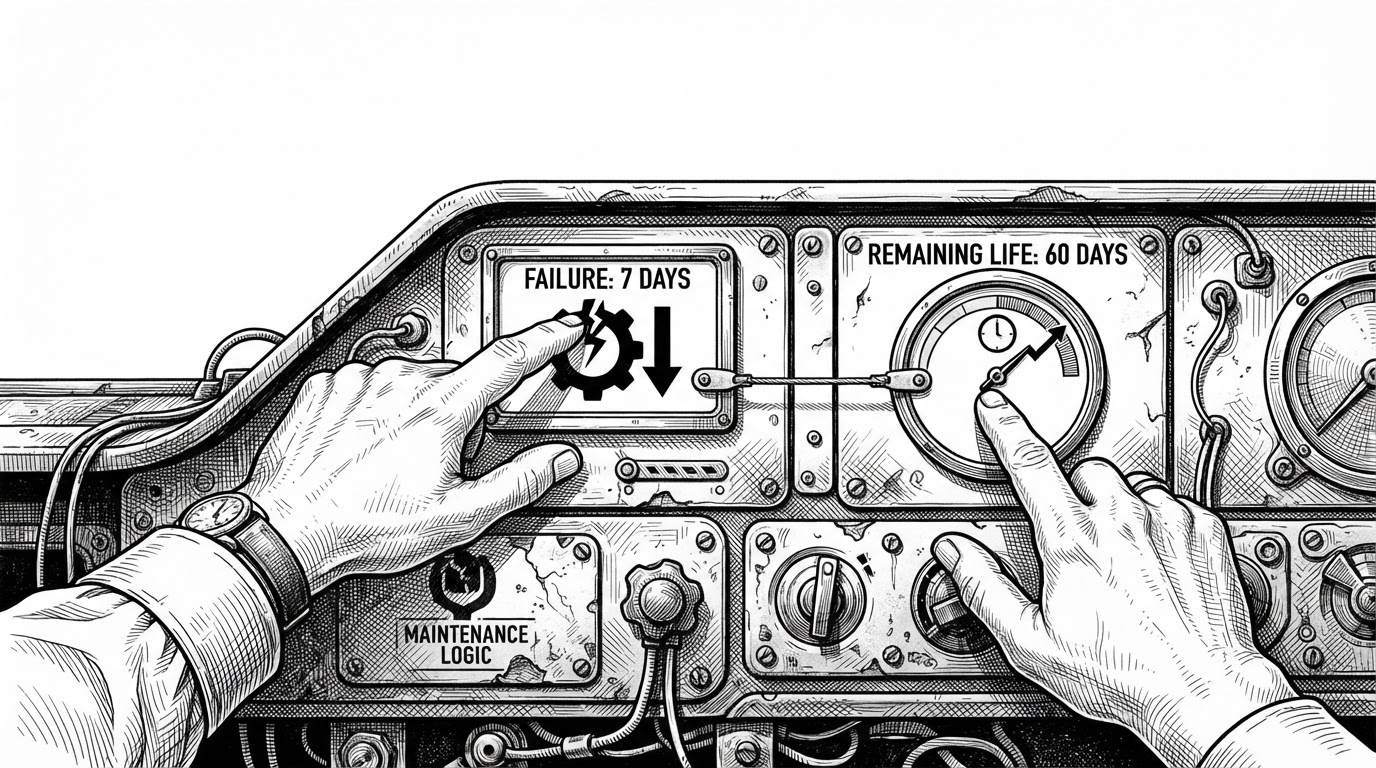
The modeling design is more interesting than the algorithm choice. The repo uses one branch to classify whether failure is imminent and another to estimate remaining useful life in days. XGBoost is a pragmatic fit here because tabular sensor features usually reward strong tree-based methods more than exotic architectures.
| Binary failure model | RUL regression model |
|---|---|
| Answers yes or no | Answers how many days remain |
| Optimized for urgency | Optimized for planning |
| Useful for immediate intervention | Useful for scheduling maintenance |
| Communicates threshold risk | Communicates trajectory |
| Best read with a deadline | Best read with a calendar |
That pairing is the heart of the repo’s trust story. A binary alert says something is wrong. A remaining-life estimate says how much room the team has to respond.
The handoff from notebook to operator
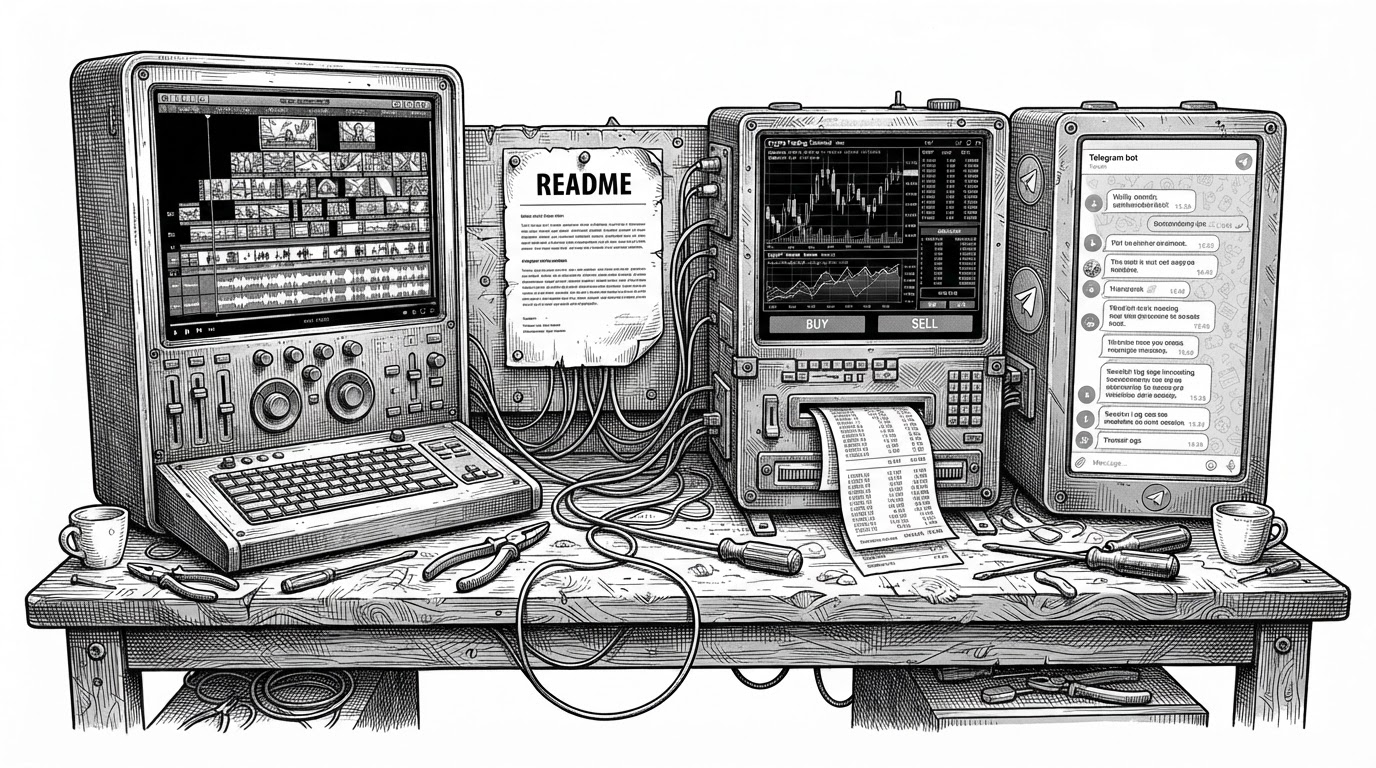
The last mile matters here. The repository pairs a custom UI for instant predictions with a Tableau layer for fleet-level visibility, which keeps the operator workflow separate from the reporting workflow.
That split is smart. It avoids forcing one interface to do everything, and it respects the difference between a technician checking one machine and a manager scanning a plant.
What this repo gets right, and what it leaves open
| Strength | Tradeoff |
|---|---|
| Portable Colab-based Spark setup | Not a true distributed deployment |
| Clear maintenance horizon | Hard-coded business assumption |
| Dual outputs for decision support | More moving parts to validate |
| UI plus Tableau split | More surface area to maintain |
| Clean, readable notebook pipeline | Early-stage project maturity |
The project is strongest as a prototype of decision architecture. It compresses uncertainty into a short maintenance deadline, then gives that deadline two different machine-learning views and two different user-facing surfaces. What it does not yet prove is production scale, governance, or long-term model monitoring.
That limitation is not a flaw in the article’s core idea. It is the point. Smart-Factory-Insights shows how far a well-shaped pipeline can get when the goal is not just prediction, but action.