`salarios_CONICET`: The Python repo that turns inflation into a forensic record of scientific pay
How a small, specialized codebase scrapes official data, stitches broken salary histories together, and tracks what Argentine researchers and professors can actually buy.


Actualicé el análisis de evolución de salarios y estipendios de CONICET. Lamentablemente la pérdida de poder adquisitivo sigue siendo brutal.
- This repo turns salary politics into a reproducible audit trail built from inflation series, pay records, and public checks.
- Its most distinctive move is historical stitching, where overlapping months are used to fuse broken salary series into one continuous ledger.
- The project is strongest when it shows assumptions openly, especially in its forecast scenarios and source validation.
- It replaces static commentary with code that can be rerun, challenged, and updated by anyone who has the data.
This repository does not behave like a normal salary chart project. It behaves like an evidence file. The point is not to say that scientific pay in Argentina has been hit by inflation. The point is to show exactly how the claim is built, from official IPC series to historical salary records and the messy seams between them.
Why this repo matters
salarios_CONICET is a public ledger for a specific kind of loss: the purchasing power of researchers, fellows, and university staff. It is useful because it makes the methodology inspectable. You can trace the inputs, inspect the transforms, and challenge the output instead of taking a finished chart on trust.
From raw inflation files to real pesos
The pipeline is intentionally plain. It downloads IPC data, merges it with salary records, normalizes nominal wages into real terms, and writes processed files back out. That simplicity matters. The repository is built for auditability, not for software theater.
At the core is a left merge and a normalization step. Nominal salary is not the story by itself. Real salary is the story, because that is the number that says what the paycheck can actually buy after inflation has had its cut.
salarios = salarios.merge(ipc, on='mes', how='left')
salarios['salario_real'] = salarios['salario_nominal'] / salarios['ipc_indice']
salarios['salario_real'] = salarios['salario_real'] * ipc['ipc_indice'].iloc[-1]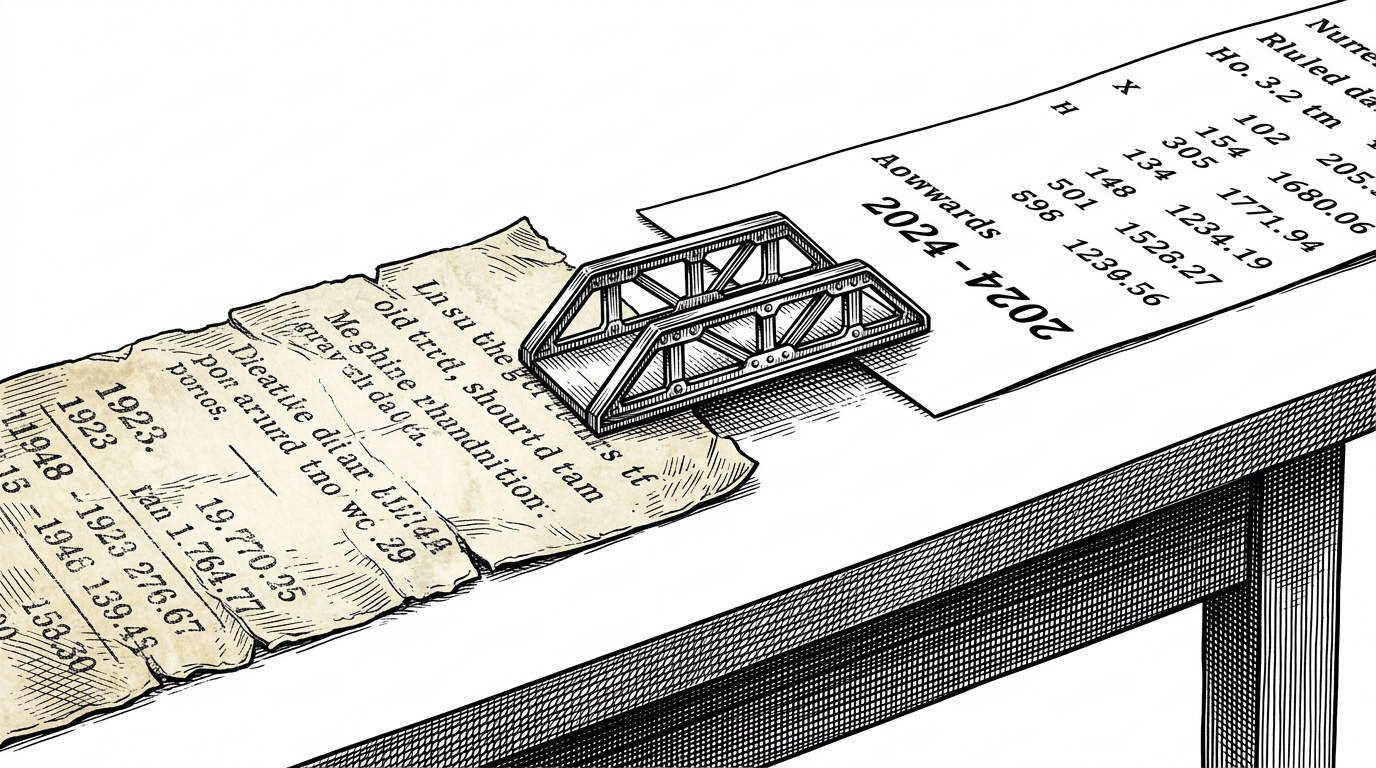
The clever part: stitching broken history into one series
This is the repository's best idea. It takes two salary histories that do not quite share the same measurement logic, finds an overlap month, computes a conversion factor, and rescales the older series to match the newer one. That is not cosmetic cleanup. It is a disciplined way to admit that institutional records are fragmented without giving up on continuity.
The result is a continuous timeline that does not pretend the source data was clean. It says: here is the seam, here is the overlap, here is the ratio that makes the old and new series comparable. That is a stronger argument than pretending the whole history arrived in one tidy file.
Mariano Barrera, quoted in mdzol, describes one of the deeper reasons this sort of reconstruction matters: the wage story is not just about one bad year. It is about how policy freezes, bargaining delays, and inflation compound across time.
Forecasting what salaries do next
The projection layer makes assumptions visible instead of hiding them. `proyeccion_profasis.py` lays out multiple futures, including one where wages track inflation, one with negotiated bumps, and one where purchasing power keeps eroding. The value is not prediction theater. It is scenario discipline.
| Scenario | What it assumes | Why it matters |
|---|---|---|
| Tracks IPC | Salaries keep pace with inflation month by month. | Shows the floor for preserving purchasing power. |
| Negotiated bumps | Inflation plus discrete raises from bargaining. | Makes the effect of labor wins explicit instead of implied. |
| Pessimistic erosion | Inflation outpaces raises and real value keeps falling. | Shows what happens when wage recovery never catches up. |
future['scenario_ipc'] = base * inflation_path
future['scenario_41'] = future['scenario_ipc'] * 1.041
future['scenario_pessimistic'] = future['scenario_ipc'] * erosion_factor
Why the charts carry political context
The charts are not neutral lines on a white page. In `graf_cic.py`, background bands mark presidential eras and policy periods, so the wage series sits inside a historical frame. That changes the reading. A drop is no longer just a drop. It is a drop under a specific administration, inside a specific economic regime.
That is where the repository becomes editorial. It does not only calculate. It narrates, by placing the line in political time.
What this repo replaces
| Lens | Official tables | Union or advocacy reporting | This repo |
|---|---|---|---|
| Source type | Government and institutional salary scales. | Press releases, PDFs, and campaign materials. | Open code plus processed data. |
| Update cadence | Periodic and fragmented. | Depends on the campaign cycle. | Designed to be rerun when data changes. |
| Historical depth | Often limited or hard to compare. | Usually focused on the current dispute. | Built to reconstruct long series. |
| Reproducibility | Low for outsiders. | Low to medium. | High, because the method is inspectable. |
| Future scenarios | Rare. | Sometimes rhetorical. | Explicitly modeled. |
The interesting part is not that the repo is more colorful than official documents. It is that it is a different kind of object. Static reports explain a moment. This project builds a living series that can absorb new data, new disputes, and new years without changing its basic method.
Sources and method
The method is practical: official IPC data, salary records, historical reconstruction, and validation against pay stubs and related artifacts when available. The repository favors transparency over abstraction. It is a small tool with a clear job, and that is why it works.