vercel-labs/workflow-priority-queue and the Rise of the Self-Explaining App
How Vercel Labs uses static analysis and durable execution to turn raw source code into a real-time, interactive debugger.
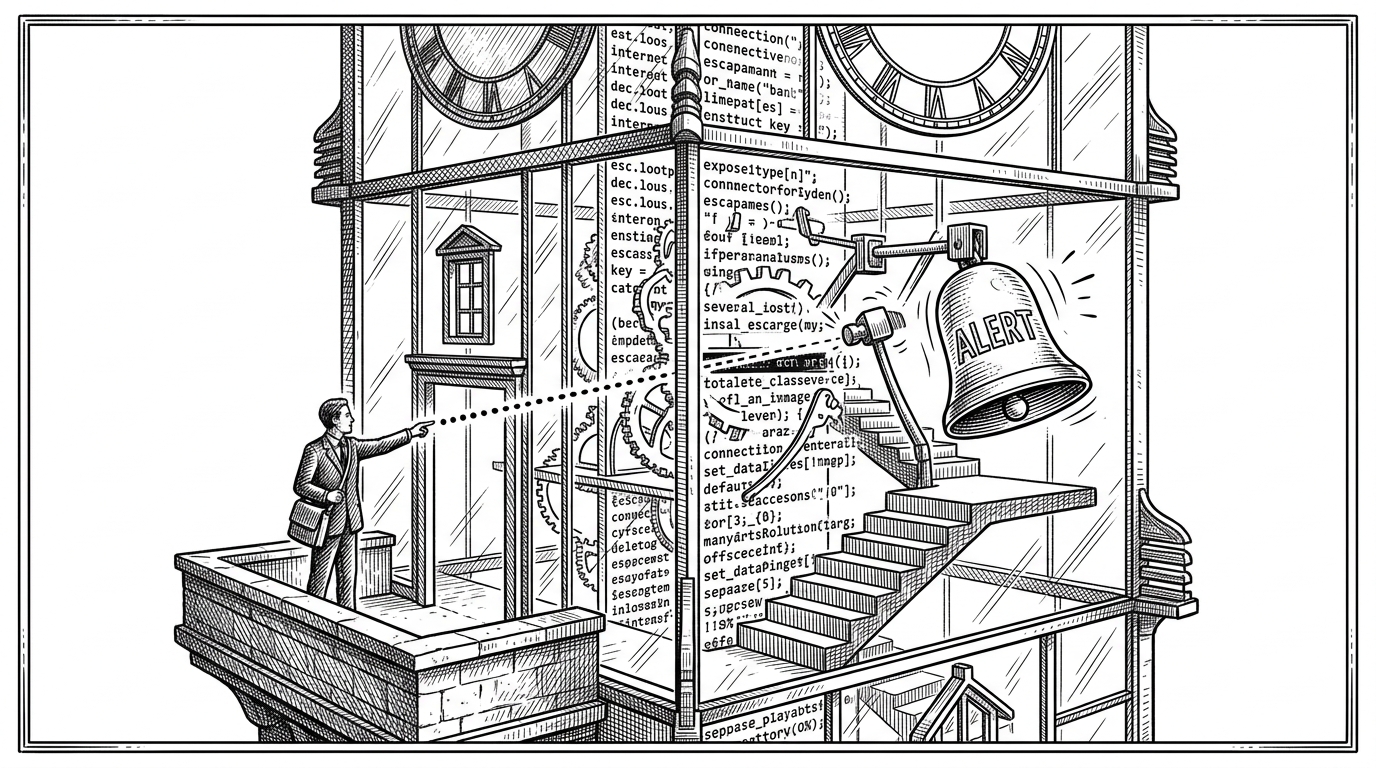
- The Workbench UI uses static analysis to map raw server-side source code to interactive frontend coordinates.
- Durable execution primitives allow serverless workflows to resume from their exact state after a timeout or restart.
- Server-Sent Events broadcast real-time execution steps to provide a live, code-level debugger in the browser.
- The system replaces external Redis infrastructure with a zero-config serverless state machine for managing task priority.
Watching the Code Breathe
Most developers treat workflows as black boxes. You trigger a function, wait for a webhook, and hope it finishes. The Vercel Labs priority queue flips this paradigm entirely. Its most striking feature is not the queueing logic itself, but the Workbench UI that accompanies it. This interface is a live reflection of the source code's execution state.
When a task is processed, the frontend highlights the exact line of TypeScript running in the cloud. It achieves this by using static analysis to read its own `.ts` files on the server, mapping those lines to UI coordinates, and subscribing to durable execution steps via Server-Sent Events. The result is a blueprint for self-explaining code.
The Durable Handshake
Standard queues often fail in serverless environments due to timeouts and statelessness. To solve this, the project relies on durable execution primitives. By wrapping orchestrator logic in a "use workflow" directive and individual tasks in "use step", the application remembers its exact position. If the underlying serverless function is killed and restarted, the workflow resumes precisely where it left off without re-running completed steps.
Hi @kulterryan, you can use the Workflows kit for any queue based use case. There are plenty of examples in this repo. Here's one that involves Postgres database: https://github.com/vercel/workflow-examples/tree/main/rag-agent
From Disk to Gutter
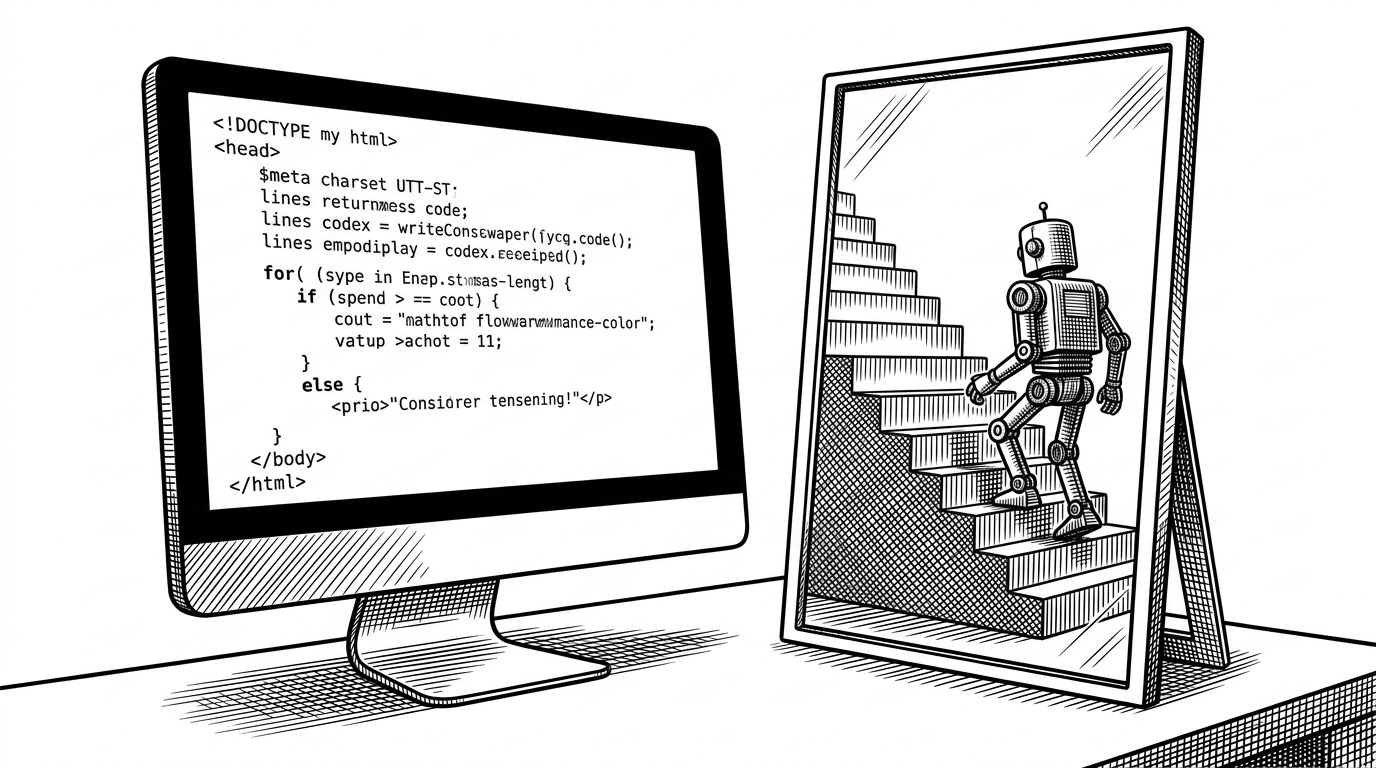
The magic of the visual debugger lies in the page.tsx file. The server literally reads priority-queue.ts from the disk using fs.readFileSync. It applies regex-based block extraction to find exactly where functions start and end, building a line map.
These line numbers are passed to the frontend. As the workflow executes, it broadcasts its internal state changes (like sorting or processing_task) through a TransformStream. The UI consumes these standard SSE events and places status icons in the code gutter, mimicking a sophisticated IDE test runner.
Avoiding the Linear Slowdown
A priority queue must handle tasks based on importance rather than simple arrival time. Managing a list of tasks efficiently is critical to avoid O(n) performance degradation as the queue grows. The workflow manages this by sorting tasks via a predefined priority map and processing them sequentially within durable steps.
| Feature | BullMQ (Traditional) | Workflow Priority Queue |
|---|---|---|
| Infrastructure | Redis Server Required | Zero-config Serverless |
| Persistence | External Database | Durable State Machine |
| Visibility | Third-party Dashboard | Self-mapping Code UI |

This approach represents a shift in internal tooling. By collapsing the gap between documentation, source code, and runtime monitoring, code-as-UI patterns make complex distributed systems immediately legible to the developers operating them.