x64dbg/wiki: The Operating Manual Behind a Windows Debugger Platform
How a documentation repo became the place where x64dbg encodes its architecture, its contributor rules, and the tricks that keep labels, plugins, and workflows intact across x86, x64, and ASLR.

- x64dbg/wiki is not just documentation. It is the project’s control plane, where architecture, contribution rules, and ecosystem boundaries stay legible.
- The repo’s most important technical idea is persistence by relationship, not by raw address, which is why labels and comments can survive ASLR.
- x64dbg treats the split between engine and UI as a design feature, then documents the bridge so contributors do not accidentally collapse it.
- The maturity of the project shows up in its discipline. Formatting, internal types, plugin boundaries, and PR-gated docs all keep a powerful debugger coherent.
The wiki is the control plane
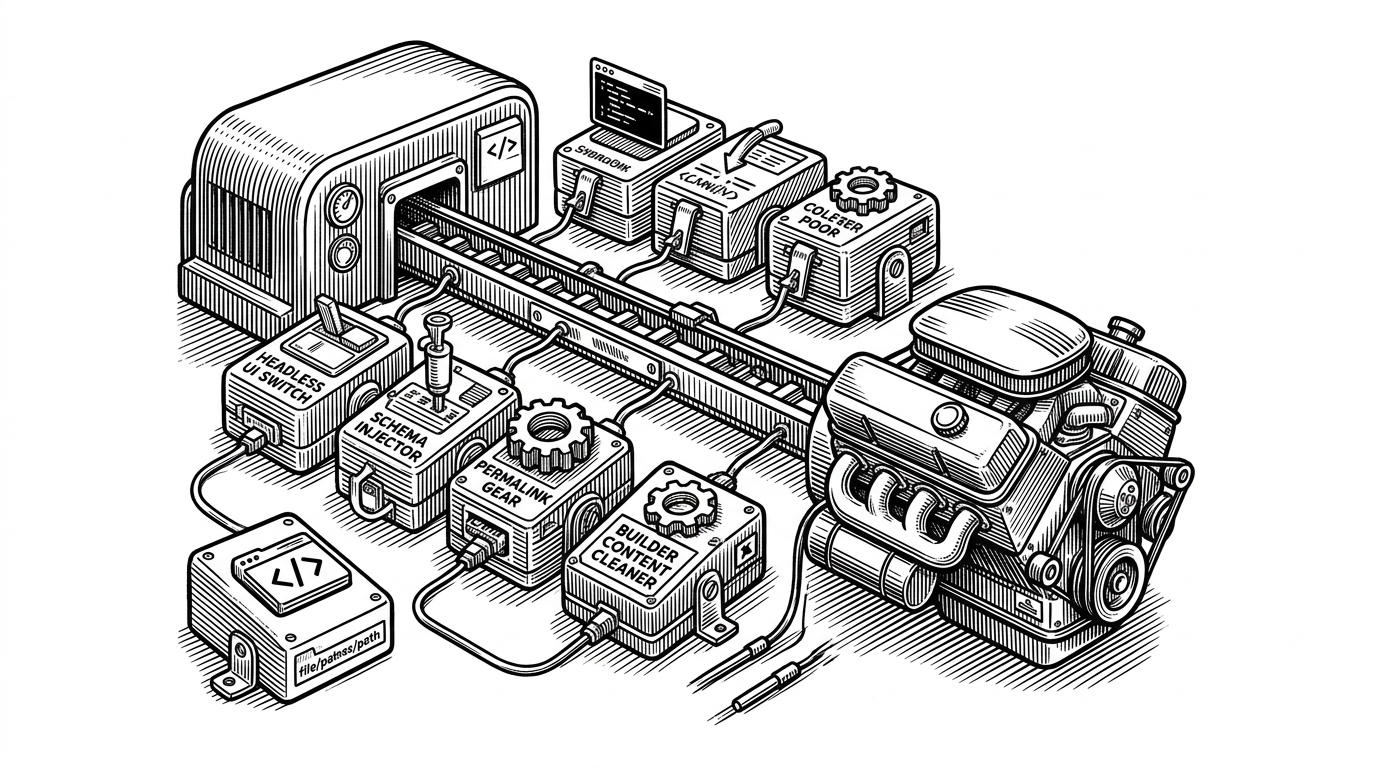
Most wiki repos explain a project. This one helps hold it together. x64dbg/wiki defines the working agreements that make a Windows debugger feel stable even though its users are doing unstable things all day long: tracing, patching, reversing, and poking at live memory.
That is the real trick here. The repository is not an accessory to x64dbg. It is the place where the project explains its own boundaries, its data model, its extension points, and the rules that keep contributors from turning a sharp tool into a drift machine.
Why x64dbg needs a contract
x64dbg serves two audiences at once. Users need practical guidance. Contributors need architecture, conventions, and a shared notion of what should never change casually. The move from a public wiki to a pull-request based repo is not just governance theater. It is a technical decision about consistency.
| Problem | Typical approach | x64dbg approach | Why it matters |
|---|---|---|---|
| Address persistence | Store absolute addresses and hope the binary stays put | Store metadata relative to the module base | Labels, comments, and bookmarks survive ASLR and relaunches |
| Cross-architecture code | Scatter x86 and x64 special cases through the codebase | Use internal types like duint and dsint | The debugger reasons about addresses without constantly rewriting itself |
| Engine and UI coupling | Let UI code reach directly into engine internals | Route communication through a bridge layer | The boundary stays explicit, testable, and easier to extend |
| Contributor workflow | Let public docs drift and get edited ad hoc | Keep docs in a repo with PR review | The project preserves a stable source of truth |
| Extensibility | Advertise plugins vaguely | Document plugin expectations and ecosystem paths | Third-party tooling can plug in without guessing |
The debugger’s first trick: one codebase, two architectures
A debugger lives in address space. It talks about pointers constantly, so architecture details are not background noise. They are the work. x64dbg’s wiki makes that explicit by documenting internal types such as duint and dsint, which abstract away the differences between 32-bit and 64-bit builds.
using duint = unsigned long long; // conceptual example
using dsint = long long;          // conceptual example

// The point is not the exact typedef here.
// The point is that the rest of the code can reason in one vocabulary.
That matters because the debugger’s job is to hold a consistent model of memory while the target process keeps changing shape. If the core logic constantly re-learns whether it is dealing with x86 or x64, the rest of the system becomes fragile. The internal type layer is a small discipline that buys a lot of stability.
The database that survives ASLR
This is the article’s sharpest technical idea. x64dbg stores user metadata, such as comments, labels, and bookmarks, in a compressed JSON database, but it does not anchor that data to absolute virtual addresses. It stores relationships relative to the module base.
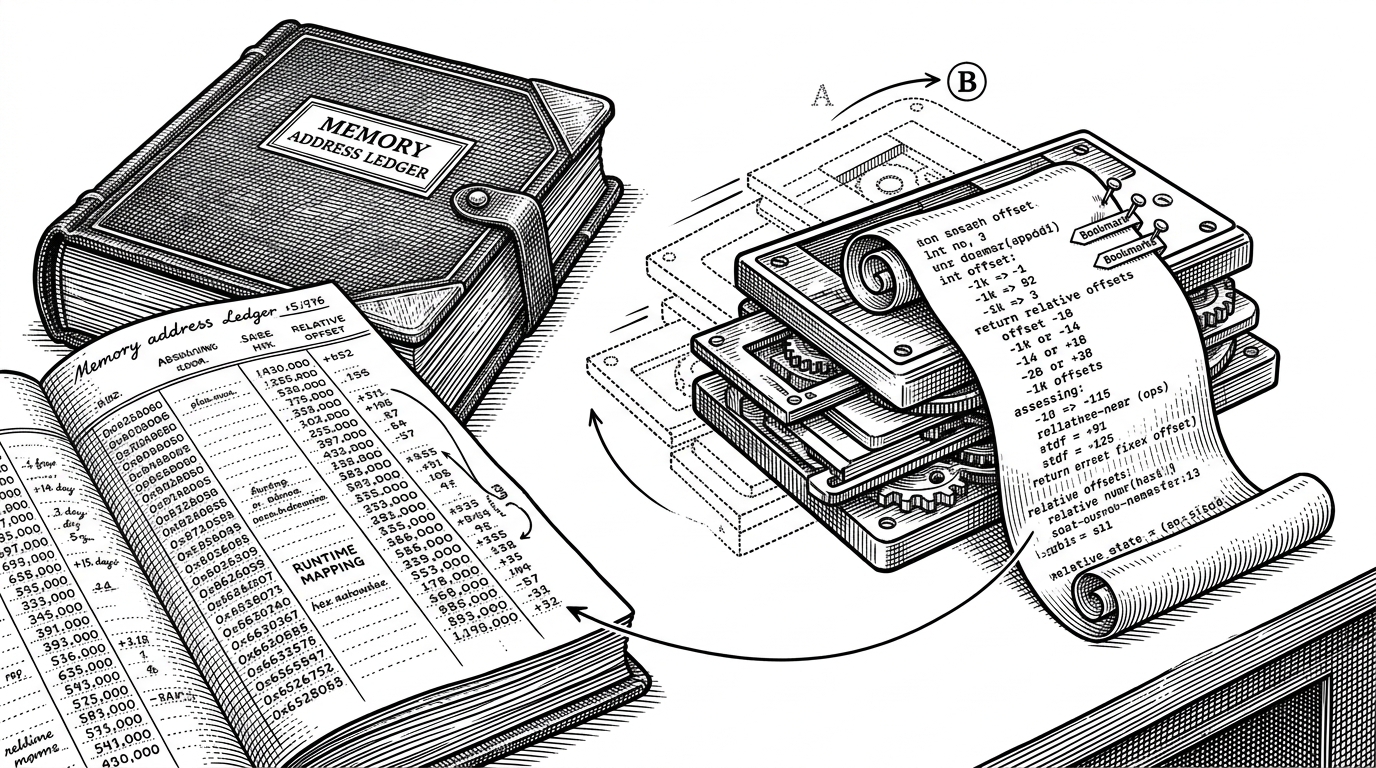
That design means the saved file remembers where something belongs inside a module, not where the module happened to land on one run of Windows. When the debugger opens the file again, it resolves the stored offset against the current base address and restores the analysis context.
| Storage choice | What breaks | What x64dbg does instead | Result |
|---|---|---|---|
| Absolute virtual address | ASLR changes the target | Store module-relative offsets | Metadata stays portable across sessions |
| Plain text notes | No structure for bookmarks or labels | Use compressed JSON | The format stays readable in spirit and efficient on disk |
| Per-run manual relinking | Users must repair notes constantly | Rehydrate automatically at load | The debugger preserves analyst flow |
The bridge between engine and UI
The wiki also reveals a more subtle architectural choice. x64dbg separates the debugger engine from the Qt UI, then exposes a controlled handshake through bridge functions such as BridgeAlloc and BridgeFree. That is not just plumbing. It is a boundary with intent.
This matters because debuggers are easy to tangle. UI code wants convenience. Engine code wants invariants. A bridge gives each side a clean contract. That makes the project easier to extend without turning every feature into a cross-thread or cross-module surprise.
Why plugins make x64dbg feel like a platform
The plugin documentation turns extensibility from a claim into a workflow. x64dbg is not merely plugin-friendly in the abstract. Its docs explain where plugins fit, how they interact with the debugger, and why the ecosystem around anti-anti-debug tools, scripting, and external reverse-engineering integrations matters.
| Platform signal | Weak version | x64dbg version | What it enables |
|---|---|---|---|
| Plugin support | A vague extension hook | A documented ecosystem surface | Third-party tools can target stable entry points |
| Tool integrations | Ad hoc community lore | Named integrations in the docs | Users can build a workflow instead of a one-off setup |
| Customization | Hidden UI tweaks | Documented styles and schemes | Power users can shape the tool without forking it |
That is how a debugger becomes a platform. Not by having an extension API alone, but by making that API legible enough that people actually build around it.
The discipline under the hood
The deeper you read, the more the repo looks like a maintenance manual for its own future. Coding guidelines, pre-commit formatting, memory wrappers, and technical debt notes all point to the same maturity signal. x64dbg expects itself to last.
Memory<char> buffer(len + 1, "formathex:new_string");
// Conceptual example: the tag exists so allocations stay attributable.
// The same instinct appears throughout the wiki.
That shows up in small places. A custom memory wrapper with a tag is not glamorous, but it tells you the project cares about tracing ownership. Formatting rules are not cosmetic when dozens of contributors touch the same low-level code. They are part of the debugger’s reliability story.
Sources and further reading
The best entry point is the repository itself: x64dbg/wiki. For technical context, see Database-format.md, Coding-Guidelines.md, Plugins.md, and Compiling-the-whole-project.md. For broader project context, see the x64dbg release announcement at x64dbg.com and the product overview at Help Net Security.