Git.M Runtime: The GPU Optimizer That Refuses to Touch Your Code
By tracing workload shape, attributing stalls causally, and testing interventions with rollback guards, Git.M turns runtime behavior into a performance control surface.
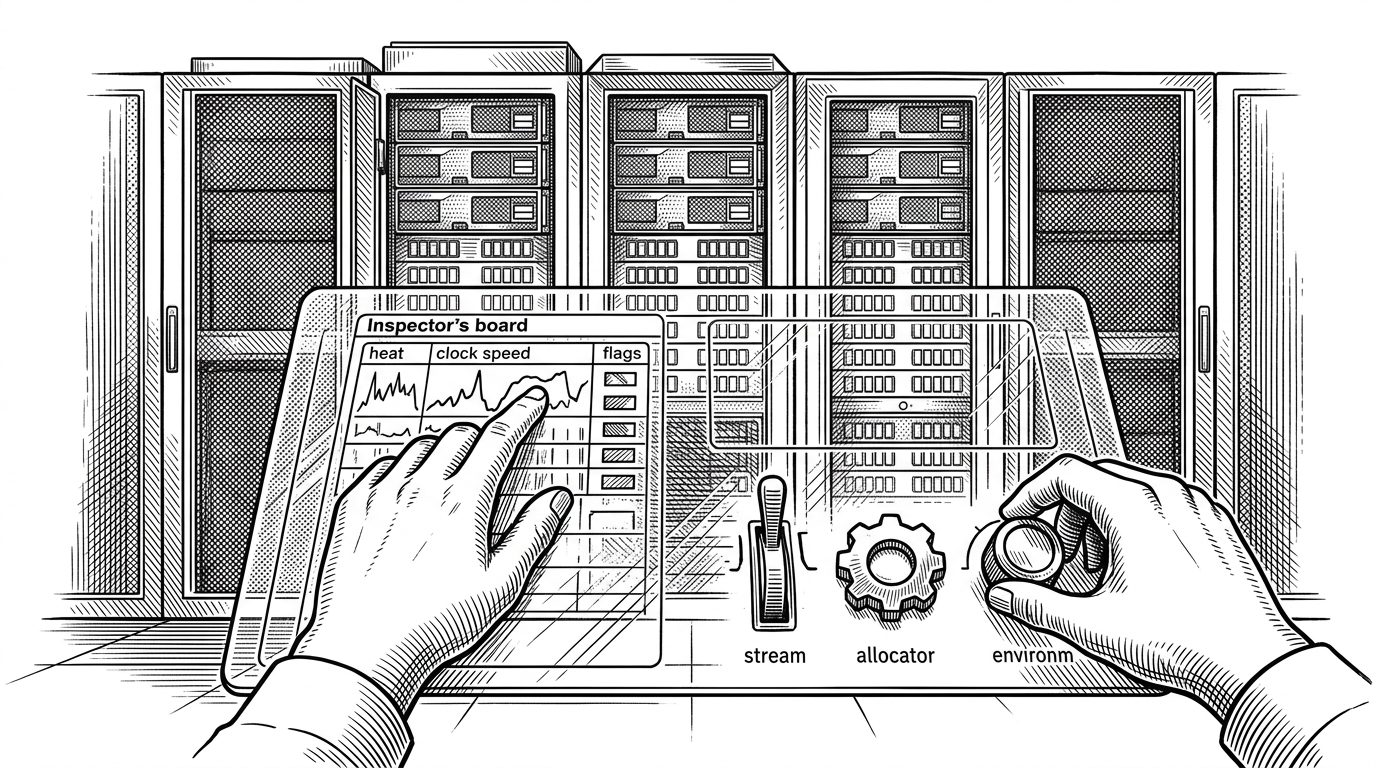
- Git.M is built around a rare premise: GPU performance can be improved from the runtime layer without touching source code or model weights.
- Its control loop is more interesting than a profiler pipeline because it fingerprints live behavior, attributes stalls, selects an intervention, and then validates or rolls back the change.
- The project's safety story is the product story, because rollback gating turns optimization into a controlled experiment instead of a one-way mutation.
- Git.M sits in a category gap between compilers, profilers, and deployment tools, which is why it feels less like a tuner and more like an intervention system.
The strange bet Git.M makes
Git.M starts with an unusual refusal. It does not ask for source code, model weights, or a rewrite of the kernel path. It watches live GPU behavior, infers the shape of the workload, and intervenes only at the runtime layer.
That matters in places where code is locked down or expensive to change. The upside is not just convenience. It is reach. A system that can optimize black-box behavior can operate where compilers cannot and where manual tuning does not scale.
In the repository, that idea shows up as a job-level runtime rather than a compiler pass. The target is not a better build artifact. The target is a better running job.
Inside the control loop
The central loop in Git.M is easy to describe and hard to build. It captures a run, fingerprints the execution shape, attributes the stall, selects a policy, then applies the change and validates the result.
def run_loop(job):
    trace = capture(job)
    shape = fingerprint(trace)
    cause = attribute(trace, shape)
    policy = select_policy(cause)
    candidate = apply(policy, job)
    if validate(candidate):
        return candidate
    return rollback(candidate)
That last line is the difference between a clever optimizer and an operational system. Git.M does not assume every intervention is safe. It treats every change as provisional until validation says otherwise.
Why the telemetry layer matters
Git.M splits observation into two tracks. One track polls hardware state in Python at a coarse cadence. The other captures low-level GPU activity through a C shim around CUPTI, which preserves fidelity at the boundary where CUDA versions and ABI details can get messy.
That split is deliberate. High-level telemetry tells you what the machine is doing. Low-level activity tells you what the workload is doing. Put together, they let Git.M separate a throttled GPU from a badly scheduled kernel and a memory bottleneck from a logging artifact.
It does not guess. It attributes
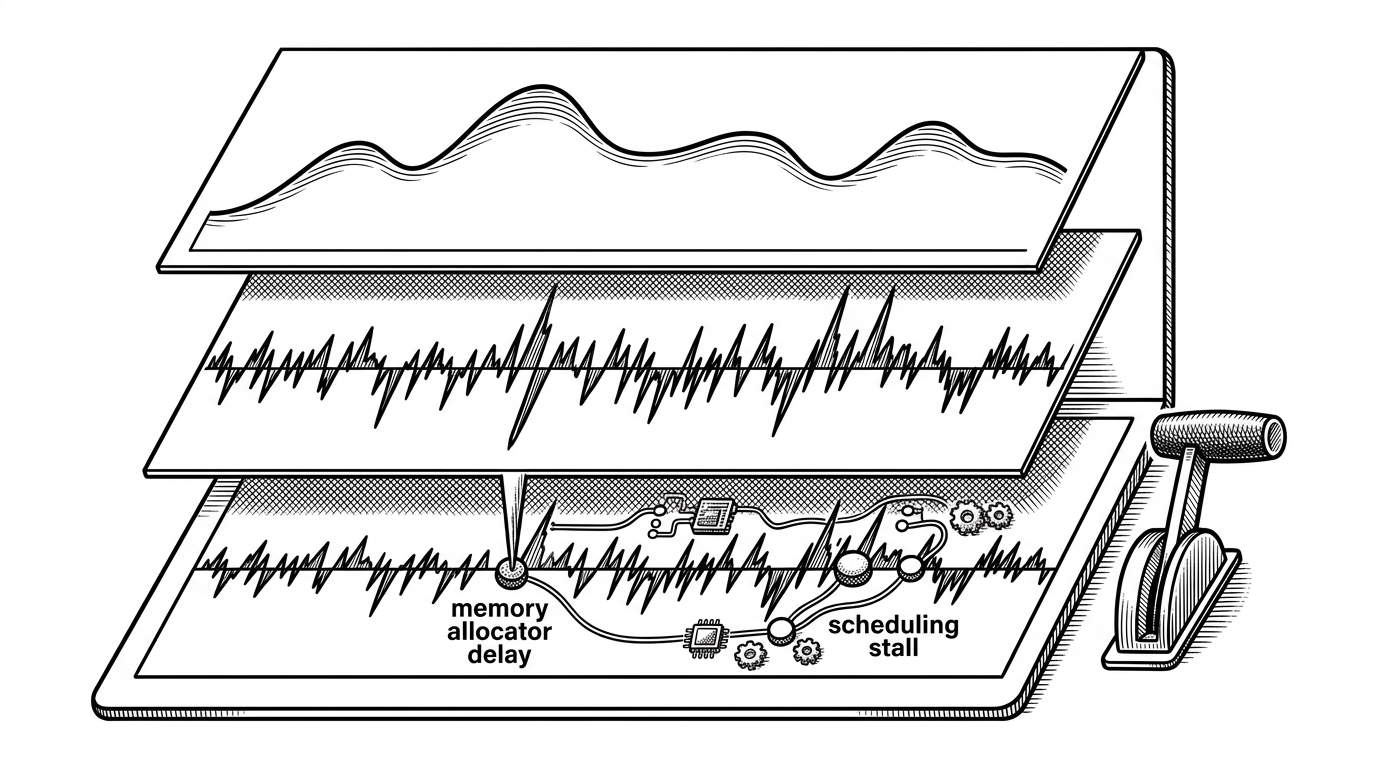
This is where Git.M becomes more than a tuning tool. It models expected duration, measures residuals, and then asks whether the gap is statistically linked to a real upstream cause. The point is not to label something as slow. The point is to explain why it is slow.
That distinction matters because GPU stalls are not all the same. A throttling event, a scheduler gap, and a memory allocator delay may look equally bad on a dashboard. Git.M tries to separate them so the fix matches the failure mode.
The repository's use of causal methods, including Granger-style attribution, is the sharpest clue to its ambition. It is not just measuring correlation after the fact. It is trying to infer which part of the runtime chain changed the outcome.
Why rollback gating is the real product
The system's trust model is simple enough to describe and hard enough to earn. If an intervention does not improve the run enough, or if it breaks output equivalence, Git.M reverses it. Optimization is treated like an experiment with a safety rail, not a permanent mutation.
That makes the project unusually practical. GPU infrastructure teams do not just need better throughput. They need confidence that a tuning system will not quietly poison a batch job, a training run, or a production inference path.
| Dimension | Traditional profiler | Compiler or graph optimizer | Git.M Runtime |
|---|---|---|---|
| Layer of operation | Observes a finished run | Changes code generation before execution | Acts on a live workload at runtime |
| Source code access | Not required | Usually required | Not required |
| Model weight access | Not required | Often irrelevant | Not required |
| Can act on live jobs | No | No | Yes |
| Can roll back changes | Not applicable | Usually manual | Yes, automatically |
| Primary value | Visibility | Static optimization | Behavioral intervention with safety checks |
How Git.M differs from compilers and profilers
The cleanest way to place Git.M is by layer. Compilers such as Triton or XLA try to make the workload itself smarter. Profilers try to make the workload visible. Git.M stands between those two worlds. It can tune live jobs by changing streams, allocators, and environment settings after the job is already running.
That middle layer is strategic. It is where locked-down environments, vendor-specific quirks, and per-workload heuristics all collide. Git.M is trying to own that space rather than compete only on code generation or observability.
Where this project seems headed
The surrounding repository hints at a broader runtime platform. There is AMD ROCm support in the tree, benchmark harnesses for domains beyond general training, and Kubernetes deployment pieces that suggest node-level operation rather than a one-off CLI trick.
That points to a future where Git.M behaves less like a single optimizer and more like a runtime intelligence layer. The likely end state is domain-specific control, where the system learns the shape of a workload class and then keeps tightening the loop around it.