`google-research/ecology-georeferencing`: the repo that teaches an LLM to find the smallest map that matters
A cost-aware Gemini pipeline filters out non-maps, reads ecology figures with surrounding context, and turns PDF pages into georeferenced data instead of dead images.
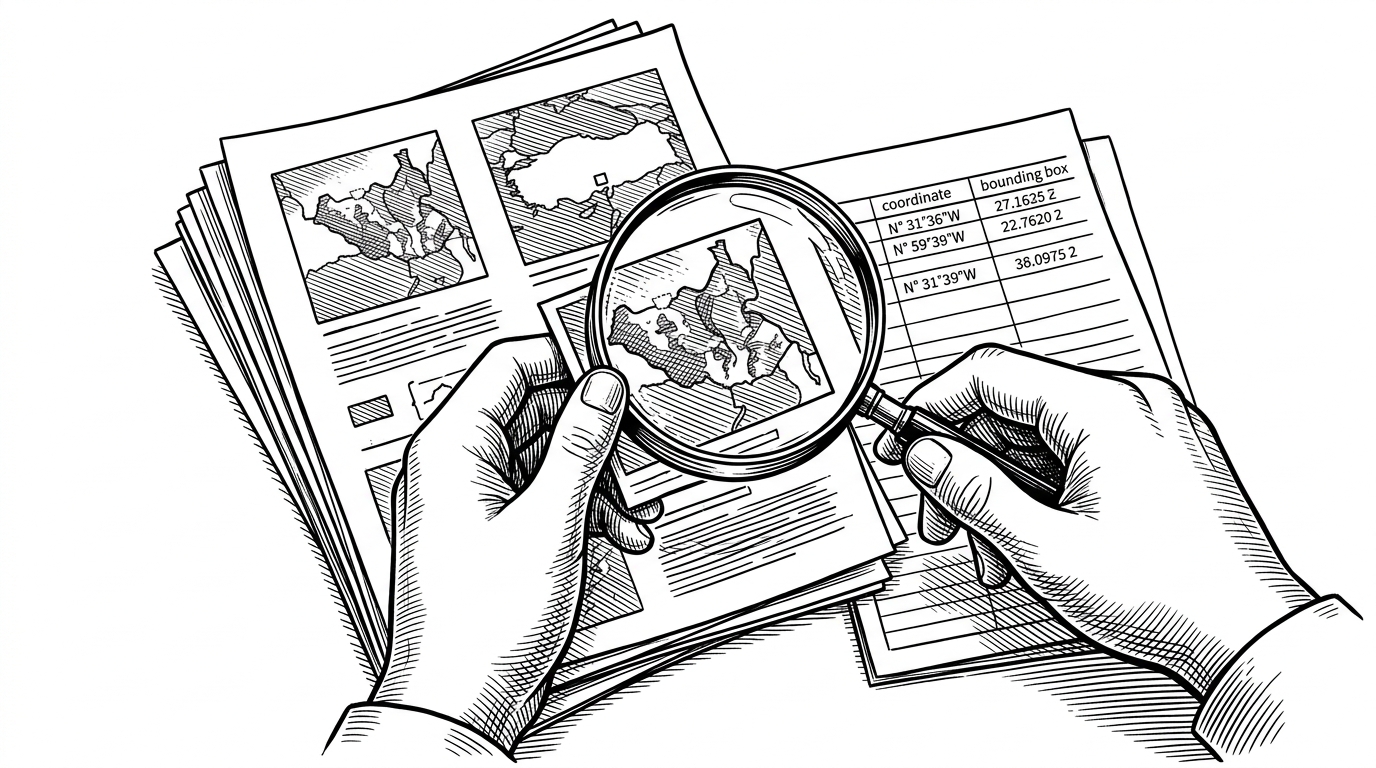
- The repo treats georeferencing as a routing problem first, so a cheap classifier spends model budget only on pages that are likely to contain maps.
- Its real insight is not map detection, but forcing the stronger model to choose the smallest useful area of interest inside cluttered ecology figures.
- The benchmark, annotations, and visualizer matter as much as the pipeline, because they turn spatial extraction into something you can inspect and compare.
- Compared with OCR, manual GIS, and generic image geolocation, this project solves a narrower and more valuable task: recovering study areas from scientific literature.
The smallest map that matters
Ecology papers hide spatial data in the least friendly place possible: figures embedded in PDFs. This repo, google-research/ecology-georeferencing, treats that archive as a machine-readable map room. The sharp idea is not to read every page, but to spend cheap model calls on classification first, then ask a stronger model to extract the smallest area of interest from the pages that actually matter.
That choice changes the problem. The model is not doing generic OCR, and it is not trying to guess where a photo was taken. It is reading ecology figures the way a careful field biologist would: identify the study map, ignore the distracting inset, and preserve the tight spatial unit that can be reused downstream.
Why ecology papers are full of lost spatial data
The repository is aimed at what the project treats as lost in plain sight data: study boundaries, survey areas, and other spatial facts trapped inside papers that were never designed as databases. That is a real bottleneck for synthesis work. If the only copy of a site boundary lives in a figure caption and a rasterized page scan, decades of evidence stay visible to humans but invisible to query systems.
The visible maintainer is Dan Morris, and the project sits in Google Research and AI for Global Development territory. That background shows up in the code: it reads like infrastructure for a stubborn data problem, not a demo built to impress for a week and vanish.
How the pipeline decides what to read
The pipeline is deliberately tiered. A small Gemini model acts as a router and answers a binary question: is this page a map worth spending more on? Only then does the heavier georeferencer receive the figure, the caption, and nearby text such as abstracts or adjacent pages. The code even estimates token usage with Gemini's tiling system, which keeps the expensive model reserved for pages that pass the first gate.
The second stage is where the thesis shows up. The prompt tells the model to return the smallest useful spatial target, not the broad context map that happens to surround it. In ecology papers, that distinction is everything. A country outline may be decorative, but the study plot is the data.
The output is strict enough to automate. The repository expects structured coordinates and uses them downstream in a Leaflet visualizer, so the model is not free-associating about geography. It is emitting a machine-readable answer that can be checked, plotted, and compared.
The benchmark is the product
This is why the repository is more than an inference script. It ships annotations for the true area of interest, the raw PDFs and images, and an index file that ties everything together. In other words, the benchmark is the product, because the only way to know whether spatial reasoning worked is to compare it against a ground truth map boundary.
index.csv
pdfs/
images/
annotations/
georeferencing/
  georeference_files.py
  prompts.json
  georeferencing_visualizer.py
  html_template.py
The visualizer closes the loop. It renders the results in a Leaflet-based interface and even includes a chat layer, which is a clever move because it turns validation into exploration. If the extraction is wrong, you see it. If it is right, you can ask follow-up questions instead of trusting a silent CSV.
Why this beats the usual geolocation playbook
The cleanest way to understand the repo is by contrast. Manual GIS georeferencing is precise but slow. OCR plus regex can pull text, but it misses layout and spatial intent. Generic image geo-localization can infer location from natural scenes, but it was not built for schematic figures in scientific papers.
| Approach | Primary task | Strength | Main failure mode | Best use case |
|---|---|---|---|---|
| Manual GIS georeferencing | Human places control points on the figure | High precision when expert time is available | Slow, expensive, and hard to scale | One-off correction of important figures |
| OCR plus regex extraction | Pull text from captions and labels | Good when coordinates are printed clearly | Misses visual layout and spatial intent | Text-heavy figures with explicit coordinate strings |
| Generic image geo-localization | Infer where an image was captured | Strong on natural scenes and landmarks | Weak on schematic maps and paper figures | Street views, photos, and remote sensing scenes |
| google-research/ecology-georeferencing | Detect maps and recover the smallest study area from ecology papers | Domain-aware, cost-aware, and outputs structured AOIs | Depends on prompt quality and is limited to figure georeferencing | Building a geospatial corpus from literature |
The point is not to replace those tools. It is to solve the narrower, harder task of recovering a study area from a messy scientific page, where the map, caption, and surrounding prose all have to agree before you can trust the output.
What this unlocks for ecology
If this scales, the payoff is bigger than convenience. Historical ecology becomes less like a library of static PDFs and more like a spatial corpus that can be queried, compared, and synthesized. That matters for biodiversity analysis, policy work, and any project that depends on older field knowledge that was never born digital.
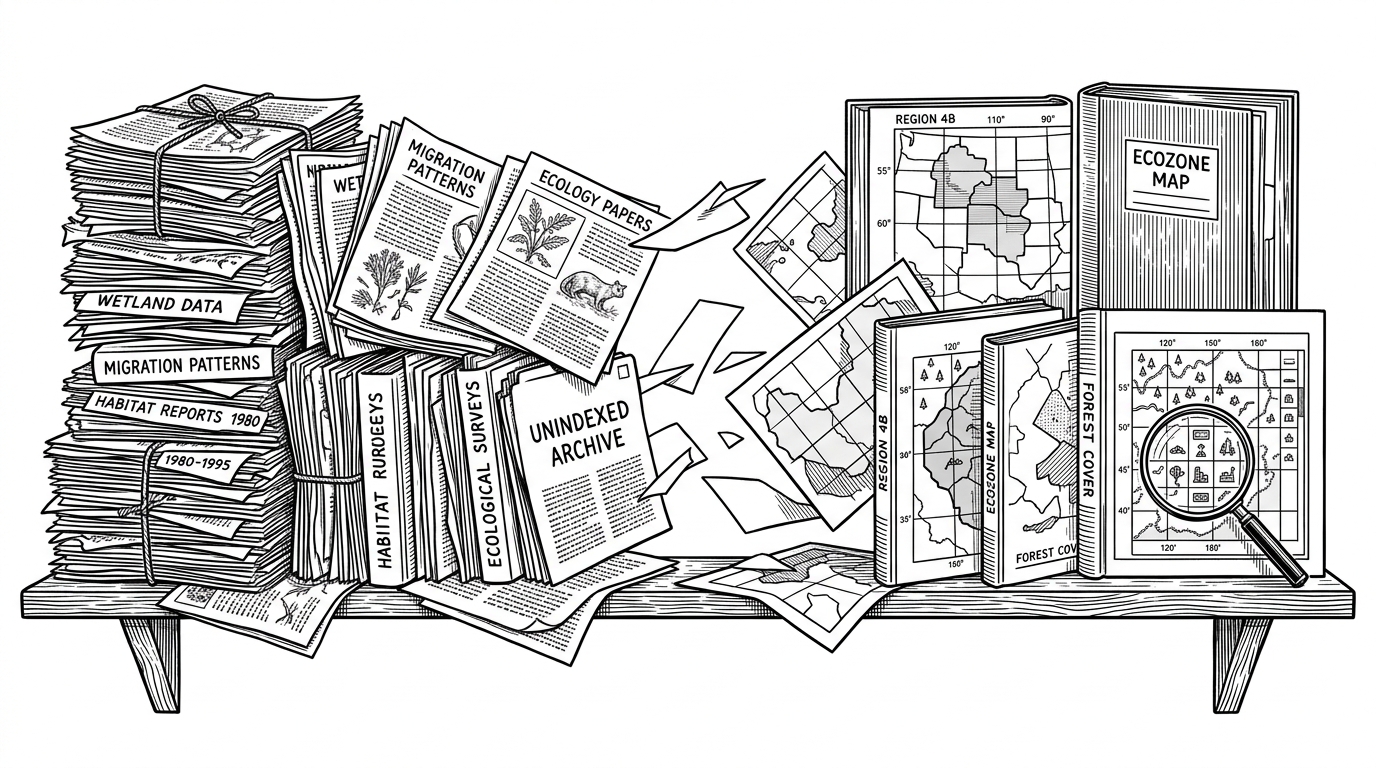
The broader lesson is about multimodal systems with judgment. The interesting benchmark is not whether a model can notice a map. It is whether it can preserve the right unit of geography under clutter, cost pressure, and domain-specific ambiguity. This repo makes that test concrete.