PaperVizAgent: Google’s Multi-Agent Studio for Turning Science Into Figures
A research framework that separates what a figure should say from how it should look, then loops in retrieval, style guidance, and critique until the result fits academic standards.
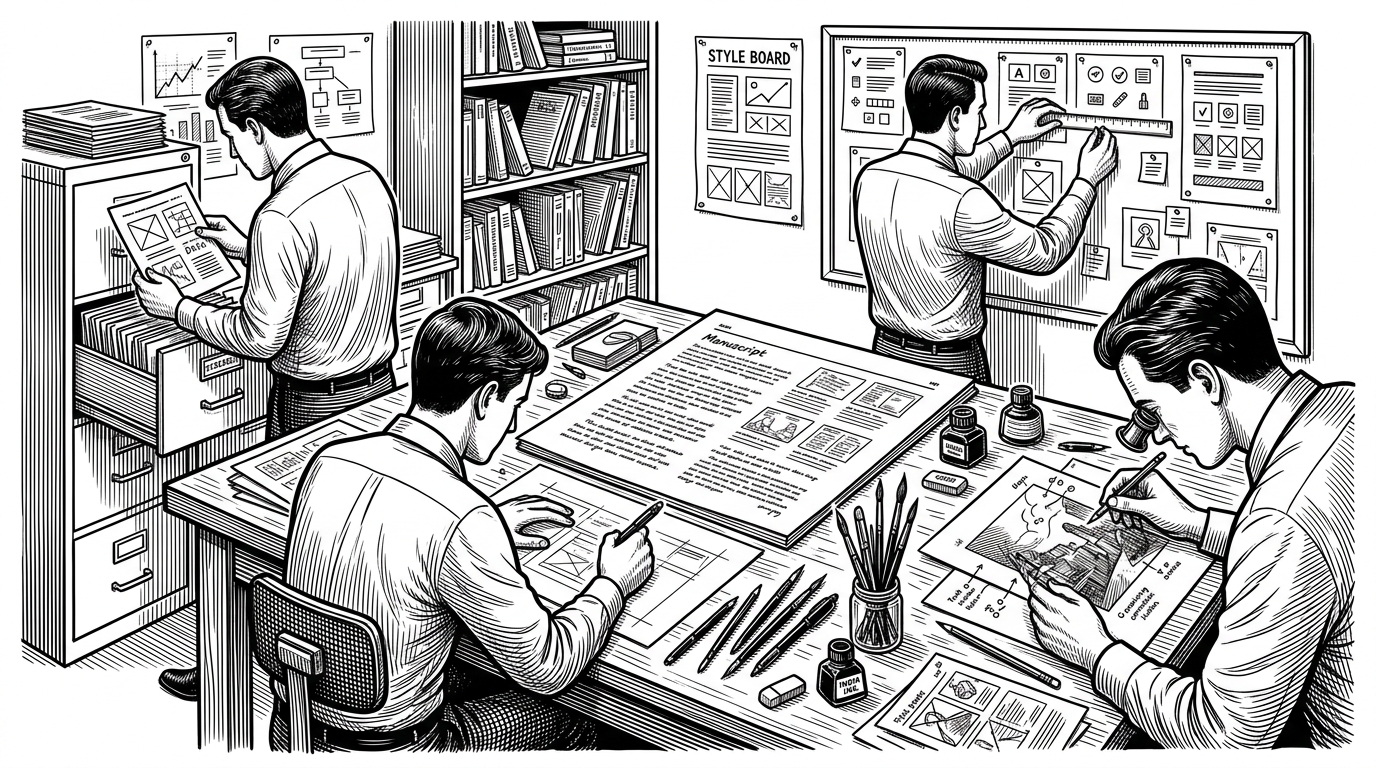
- PaperVizAgent’s real idea is not image generation, but editorial coordination across retrieval, planning, styling, rendering, and critique.
- The system separates figure meaning from figure style, which makes restyling possible without rethinking the scientific structure.
- Its plot path treats code as the source of truth, which protects numerical visualization from generative ambiguity.
- The project points toward figures as living research assets that can be revised, restyled, and regenerated on demand.
Most AI image tools try to do everything at once. PaperVizAgent does the opposite. It breaks academic figure-making into a managed studio workflow, where each agent has a job and the output gets reviewed before it is shipped.
Why academic figures break ordinary AI
Scientific figures are not just pictures. They are constrained artifacts with structure, labels, arrows, and an implied argument. A generic text-to-image model can make something that looks plausible, but plausibility is not the same as correctness.
| Approach | Strength | Weak spot |
|---|---|---|
| General-purpose image generators | Fast visual invention | They often miss exact scientific structure and label fidelity |
| Manual diagramming tools | High precision and control | They are labor-intensive and slow to revise |
| Script-based plotting libraries | Accurate data visualization | They do not solve conceptual figure generation |
| PaperVizAgent | Separates semantics, style, and review | Still depends on good retrieval, prompts, and model behavior |
This repository is the official implementation for **PaperVizAgent** (widely known as **PaperBanana**), a reference-driven multi-agent framework for automated academic illustration generation. Acting like a creative team of specialized agents, it transforms raw scientific content into publication-quality diagrams and plots through an orchestrated pipeline of **Retriever, Planner, Stylist, Visualizer, and Critic** agents.
The pipeline: retriever, planner, stylist, visualizer, critic
The architecture reads like a publication team. The Retriever looks for relevant visual examples. The Planner turns source text into a structured description of what the figure should contain. The Stylist adds aesthetic constraints from style guides. The Visualizer renders the figure. The Critic checks the result and sends it back for revision if it misses the target.
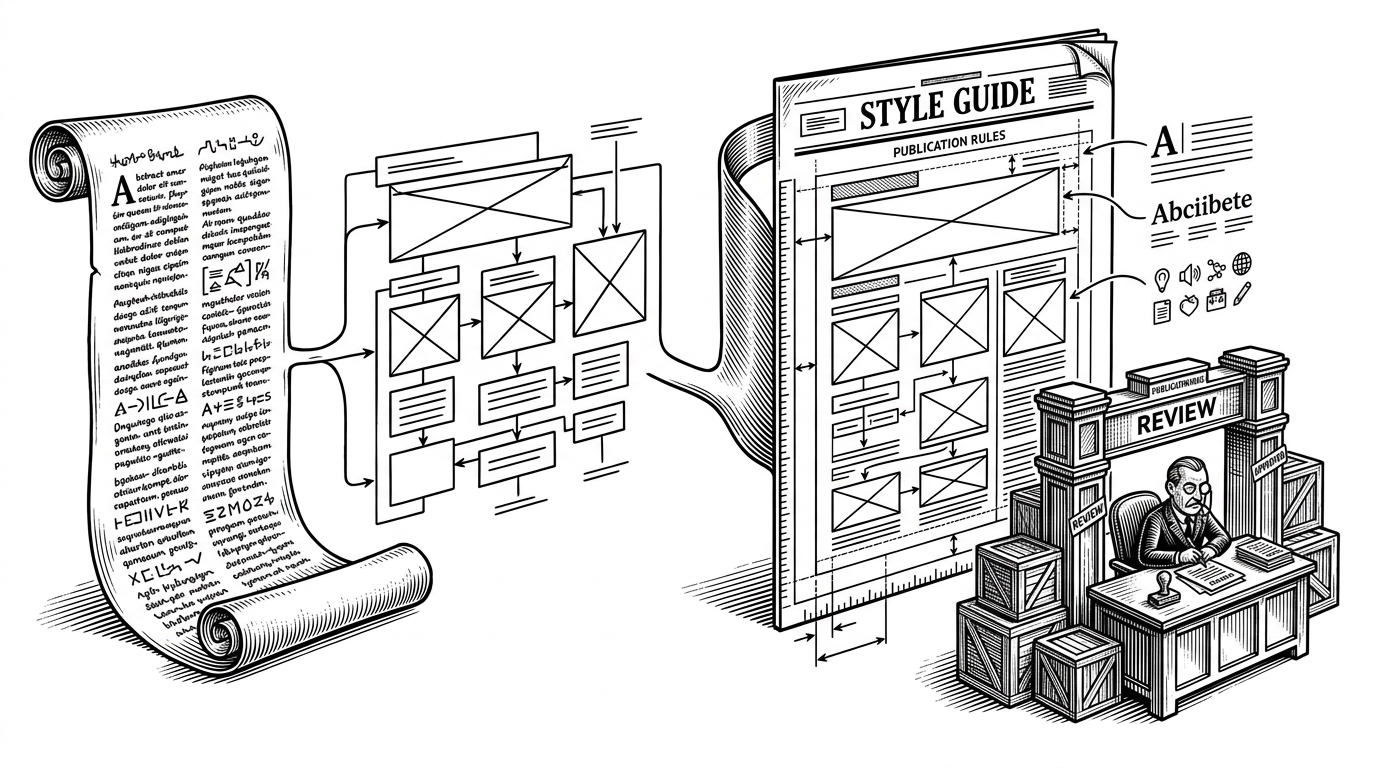
This separation is the project’s best insight. The Planner handles logic, while the Stylist handles presentation. That means a figure can be changed to fit a different venue without asking the system to rediscover the science from scratch.
| Layer | What it decides | Why it matters |
|---|---|---|
| Planner | The figure’s structure and relationships | Preserves scientific meaning |
| Stylist | The figure’s visual tone and constraints | Makes the output fit a venue |
| Visualizer | How the image is actually produced | Turns the plan into pixels |
| Critic | Whether the output matches the intent | Creates a revision loop instead of a one-shot result |
When diagrams are code and plots are code
PaperVizAgent treats plots differently from conceptual diagrams. For plots, the system extracts Python code from the model output and runs it in a subprocess. That matters because scientific charts need numerical correctness, not just a convincing shape.
# Plot mode follows a stricter path than diagram generation
code = extract_python_code(llm_response)
result = run_in_subprocess(code)
image = save_rendered_plot(result, backend="Agg")
This is a useful boundary. Generative rendering is acceptable for diagrams where layout and metaphor matter most. But for plots, the code path keeps the data layer deterministic and avoids diffusion-style mistakes.
How the critic loop changes the output
The Critic is what makes the system feel less like a prompt and more like a process. It compares the draft against the original intent, then feeds corrections back to the Visualizer. The goal is not first-pass brilliance. The goal is revision until the figure clears the bar.
That loop is easy to miss, but it is doing a lot of work. It turns figure generation into something closer to editorial review, where the output is not final just because it exists.
What PaperVizAgent is competing with
| Category | Examples | Why PaperVizAgent is different |
|---|---|---|
| General AI image generation | GPT-Image-1.5, Nano-Banana-Pro | Good at visuals, weaker on exact scientific structure |
| Manual diagramming | Visio, Lucidchart, Draw.io | Precise, but slow and hands-on |
| Script-based plotting | Matplotlib, ggplot2, D3.js | Excellent for data plots, not for guided conceptual figures |
| Research workflow agents | Other academic assistants | PaperVizAgent focuses specifically on illustration production |
So the project is not really trying to beat every visual tool at once. It occupies a narrower but important space: turning technical intent into publication-ready figures with less manual cleanup and more repeatability.
The bigger bet: figures as living artifacts
PaperVizAgent hints at a future where figures are not static assets frozen at export time. They become revisable objects inside the research workflow, ready to be restyled for a venue, regenerated at higher fidelity, or corrected when the paper changes.
That is the real shift. The breakthrough is not just that AI can draw. It is that figure production can start to look like editorial operations: specialized roles, explicit constraints, and a review loop that treats quality as a process.