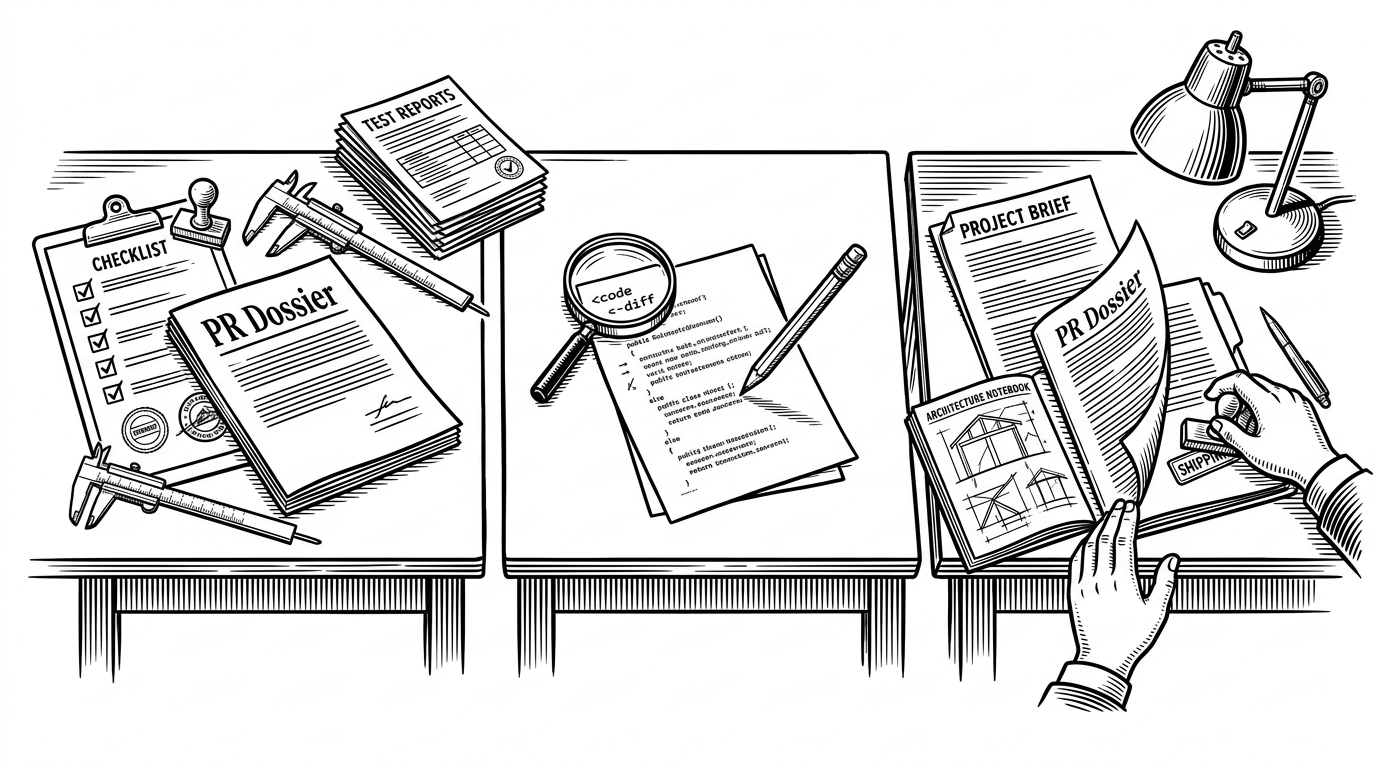
fireworks-tech-graph: The Claude Skill That Treats Diagrams Like Build Artifacts
A natural-language diagram engine with domain-aware templates, style references, and validation checks for AI and agent workflows.
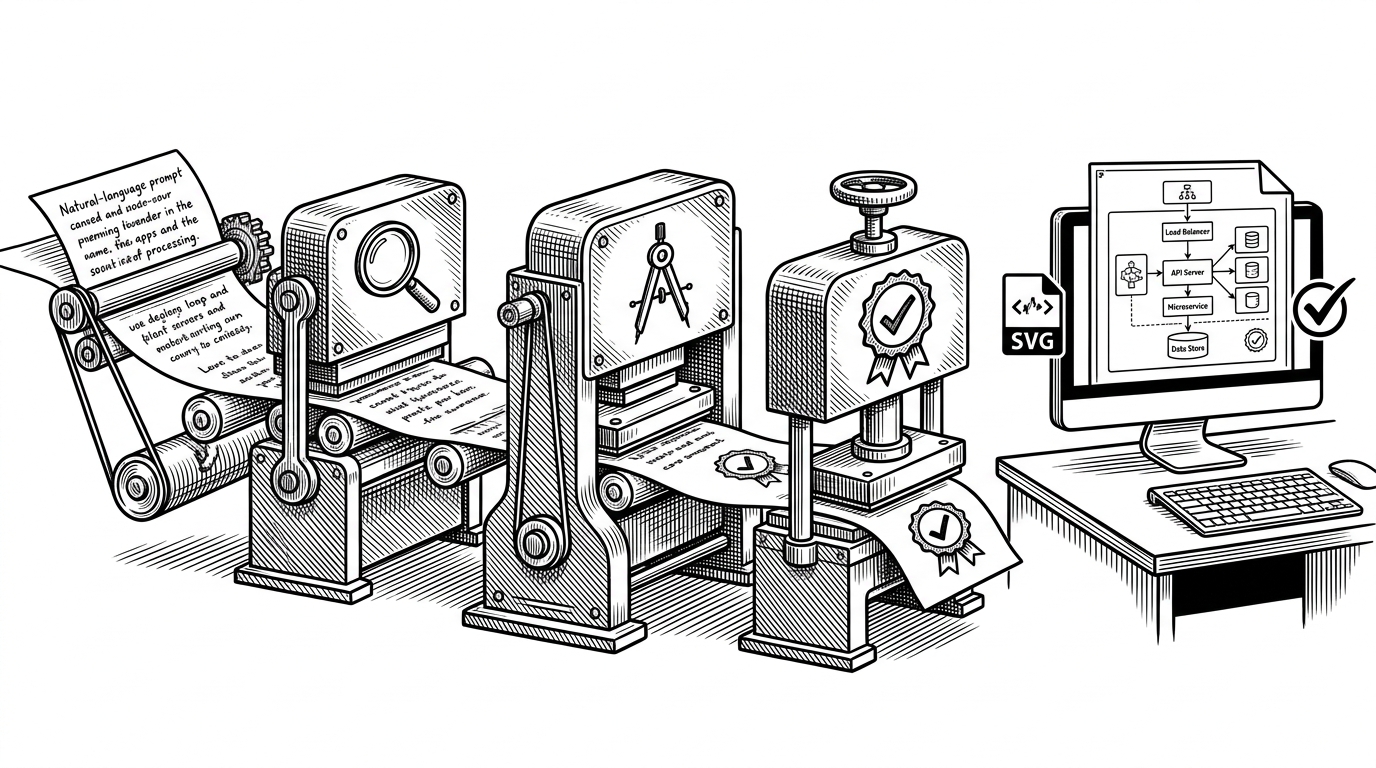
- fireworks-tech-graph turns technical diagramming into a repeatable pipeline, with classification, style loading, template fill, and validation built in.
- Its real advantage is domain knowledge for AI and agent systems, not generic diagram generation.
- The repository treats SVG output like code, then checks it like code before exporting it as a final artifact.
- Compared with Mermaid or draw.io, it is optimized for natural language input and publication-ready AI architecture visuals.
Most diagram tools start with the canvas. fireworks-tech-graph starts with the workflow. The repo turns a messy, subjective task into a sequence of controlled steps, which is why it feels closer to a build system than a drawing app.
That shift matters because technical diagrams are not just decoration. In AI systems, they are often the only artifact that explains memory, retrieval, tool calls, and multi-agent coordination without making the reader reverse-engineer a codebase.
Diagrams Are Treated Like Code, Not Canvas Art
The project’s core move is simple: take a natural-language request, classify the diagram type, extract structure, apply a style profile, validate the SVG, and export a file that is ready for docs or slides. That pipeline is what makes the repo feel industrial instead of improvised.
The README frames the product plainly: describe your system in English or Chinese and get publication-ready SVG plus PNG diagrams in seconds. That is a strong promise, but the interesting part is how the repository tries to make that promise reliable instead of magical.
The Skill That Knows Agent Diagrams
This is a Claude Code Skill, not a loose bundle of scripts. The orchestration lives in SKILL.md, which instructs the agent to follow a fixed order: classify the diagram, extract nodes and edges, load style references, and validate the output before calling it done.
Workflow order:
1. Classify diagram type
2. Extract structure
3. Load style references
4. Plan layout
5. Generate SVG
6. Validate output
7. Export PNG
That matters because it turns generation into a constrained process. Instead of asking a model to improvise a chart, the skill asks it to behave like a diagramming assistant with a checklist.
Why the Repository’s Real Moat Is Domain Knowledge
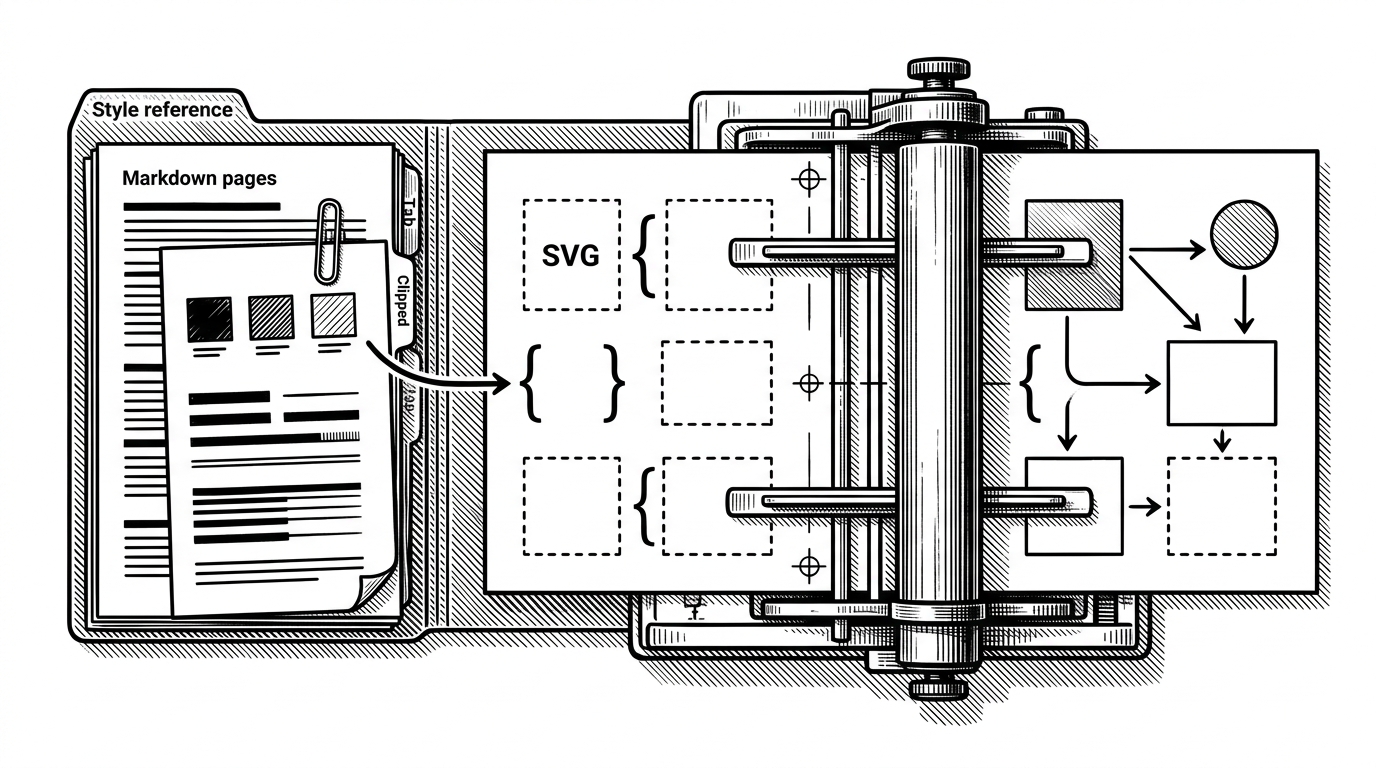
Generic diagram tools can draw boxes and arrows. This repo goes further by encoding patterns for RAG, agentic search, memory layers, multi-agent coordination, and tool calls. That is the difference between a drawable shape library and a domain-aware visualization system.
The value is semantic. A double border can mean one thing, a hexagon another, and arrow color can carry flow type. When those conventions are consistent, the diagram stops being decorative and starts carrying engineering meaning.
All samples exported at 1920px width (2× retina) via `rsvg-convert`. PNG is lossless and the right choice for technical diagrams — sharp edges, no JPEG compression artifacts on text/lines.
That emphasis on crisp output is not cosmetic. It tells you the target user is someone shipping docs, blog posts, or presentation assets where line quality and export fidelity actually matter.
How the System Works Under the Hood
The architecture is practical. Templates hold the SVG skeletons, references hold style rules, and scripts perform rendering and verification. Python does the heavy lifting, while shell scripts orchestrate conversion and validation around tools like xmllint and rsvg-convert.
That design choice gives the repo a clean separation of concerns. The model decides what should exist in the diagram, the template system decides how it should be placed, and the validator decides whether it is safe to ship.
The strongest signal is the validation loop. XML syntax checks, marker reference checks, and collision detection are not afterthoughts. They make correctness part of the product definition.
Quality Control Is Built Into the Output Loop
This is where the repo feels like engineering infrastructure. A generated SVG is not trusted because it exists. It is trusted because it survives a series of checks that look a lot like tests.
That matters for teams. If the output will be dropped into documentation, the failure mode should be explicit and inspectable. The repository is designed to fail loudly before a bad diagram becomes part of the record.
How It Compares With Mermaid, PlantUML, and draw.io
| Tool | Input method | AI and agent domain knowledge | Style control | Validation | Best fit |
|---|---|---|---|---|---|
| fireworks-tech-graph | Natural language in Claude Code | Built in | Reference driven | Yes, explicit | Publication-ready AI and agent diagrams |
| Mermaid | Text DSL | Limited | Manual or theme based | Basic | Fast lightweight diagrams |
| PlantUML | Text DSL | Limited | Theme based | Moderate | Classic UML and sequence diagrams |
| draw.io / diagrams.net | Manual GUI | None | Manual | User driven | Precise human controlled layout |
The comparison is not about winners and losers. Mermaid and PlantUML are excellent when you want a compact syntax. draw.io is strong when a human wants pixel-level control. fireworks-tech-graph sits in a different category: natural language plus domain-specific output for AI systems.
That makes it a good fit for a very specific job. If you need to sketch a standard UML class diagram, the established tools are enough. If you need a documented AI workflow with semantic arrows, style consistency, and validation, this repo is aiming at the pain point directly.
What This Says About the Future of Technical Documentation
The broader implication is simple. Diagrams are becoming versioned assets, not one-off screenshots. Once teams accept that, the next step is obvious: generate them, validate them, and keep them in sync with the systems they describe.
That is especially relevant for AI products, where architecture changes quickly and the documentation often lags behind. A skill like this compresses the gap between idea, implementation, and explanation.
The repo is not trying to replace every diagram tool. It is proving that a narrow workflow, if it is opinionated enough, can be more useful than a general one.