NVIDIA/omniperf: GitHub Pages as a Robotics Performance Database
A zero-dependency Isaac Lab dashboard uses manifest-driven JSON, Git LFS, Chart.js, and preview images to turn benchmark runs into a browsable, versioned record.
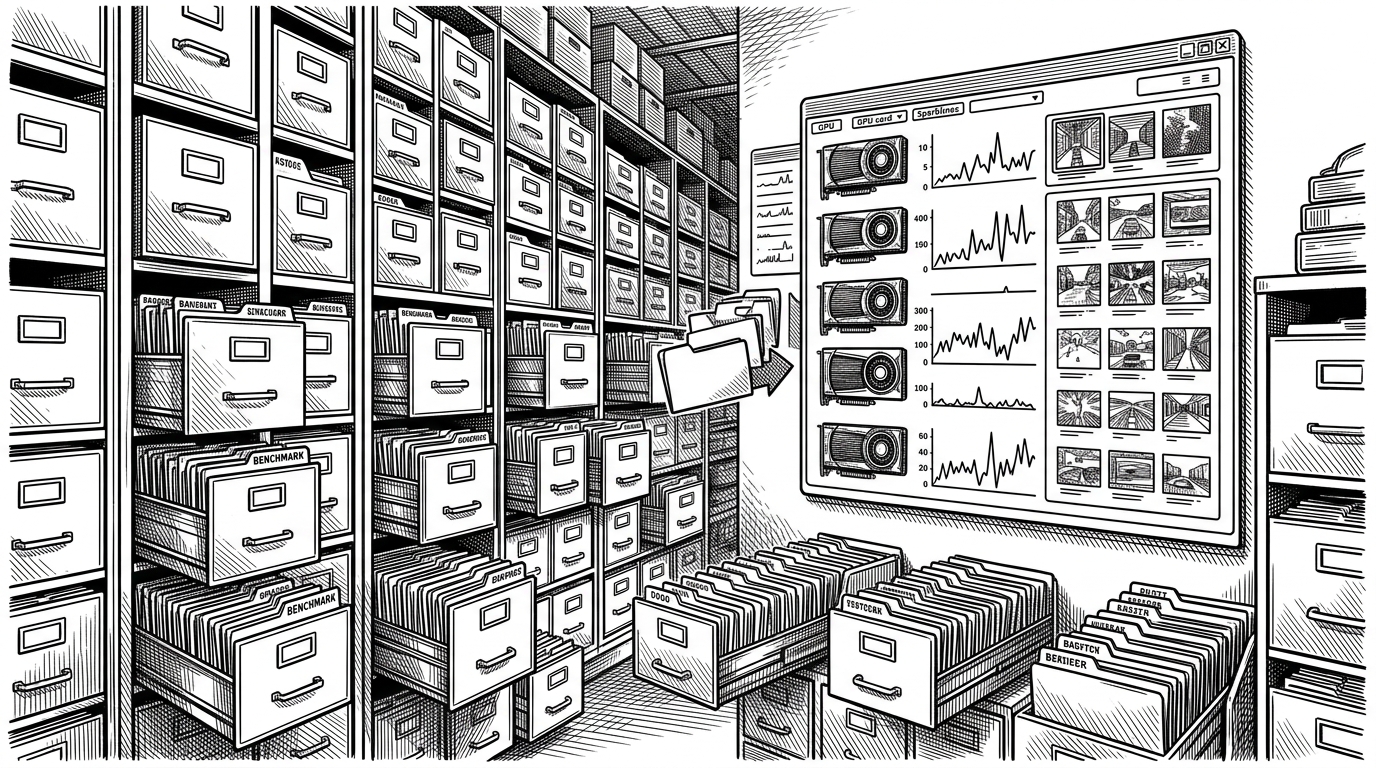
- Omniperf treats benchmark history as a versioned ledger, so each run stays inspectable long after the CI job is gone.
- The manifest, not application state, controls what the UI can show, which keeps new GPU datasets easy to add.
- Preview images turn throughput charts into evidence, so robotics regressions can be spotted even when the numbers look fine.
- Static hosting plus Git LFS gives the project durability without dragging in a backend, a database, or a framework.
The dashboard is really a ledger
Omniperf does not behave like a conventional observability app. It behaves like a tidy archive with charts on top. The important thing is not that it shows performance, but that it preserves performance history as versioned artifacts.
That is a strong fit for Isaac Lab. Robotics benchmarks need comparability more than novelty, and the repo keeps that comparison surface small: JSON files in docs/data/, preview images beside them, and a static site that reads the lot without asking a server for help.
lightweight, zero-dependency static site that tracks key performance metrics (FPS, GPU utilization, memory, startup times) for Isaac Lab benchmarks over time.
The manifest is the control plane
The clever part of Omniperf is that the front end does not discover the world by probing a backend. It loads manifest.json, learns which GPU datasets exist, and resolves the selected hardware lane into the matching data file. Tabs, filters, and comparison views all sit on top of that one indirection.
That makes the app feel simple even when the data is not. Add a new GPU dataset, point the manifest at it, and the UI can present a fresh history lane without changing the rendering code.
The rest of the interface is a thin layer of selection logic. Presets narrow the benchmark recipe, filters cut across backend and renderer choices, and the charts respond by rendering the historical slices that matter. The result is less like a live ops console and more like a well-indexed research notebook.
Why previews belong beside the metrics
Numbers tell you throughput, memory, and startup time. They do not tell you whether a gain came with a visual regression, a broken scene, or a renderer artifact that only shows up in the frame itself. Omniperf makes room for both, and that is the part most dashboards miss.
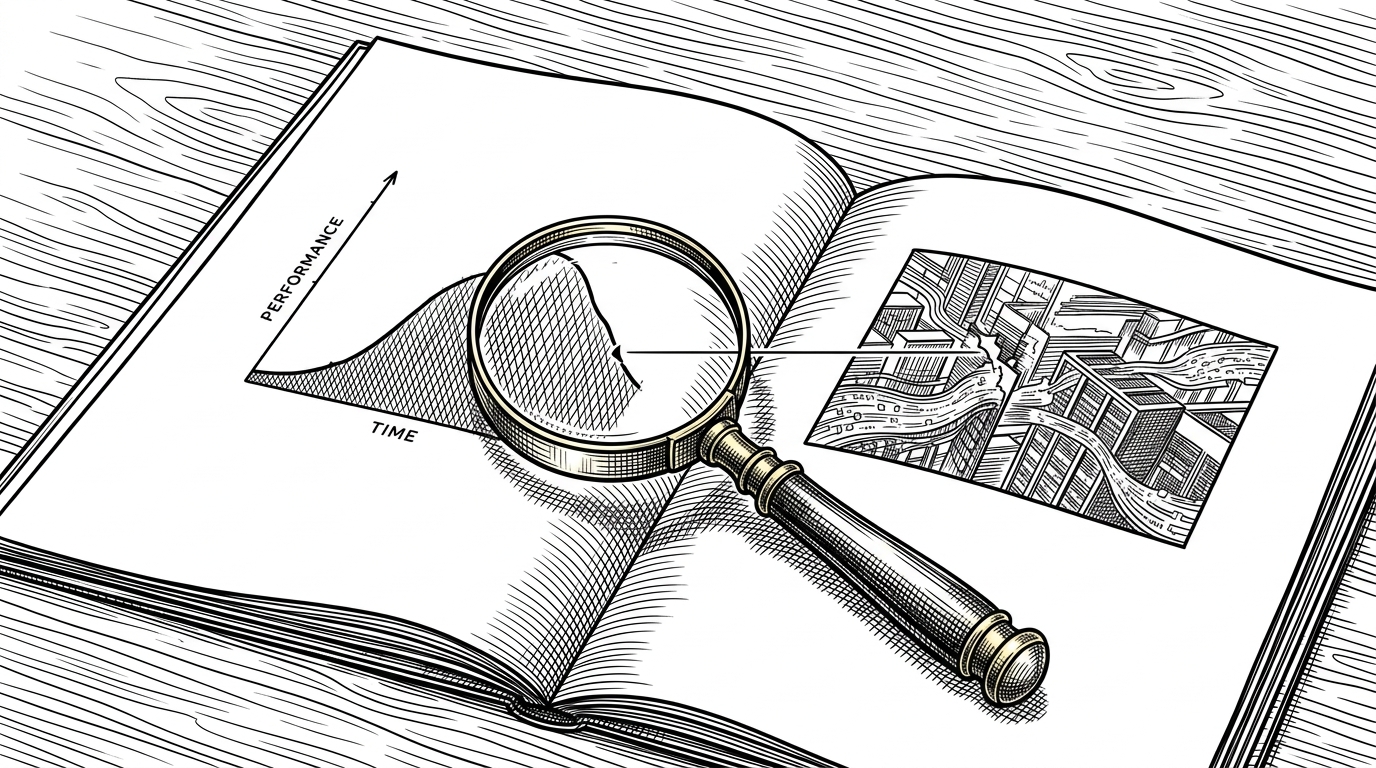
That is especially useful in robotics, where the wrong scene can still produce a pretty chart. A visual preview makes the benchmark evidence harder to misread, because it ties the curve back to what the simulator actually drew.
How NVIDIA keeps it low-friction
The maintenance story is almost as interesting as the UI. The whole project leans on static hosting, vanilla JavaScript, Chart.js, and Git LFS for the heavier history files. That combination keeps the repo portable and avoids the tax of a service layer.
cd "$(dirname "$0")/docs" && python3 -m http.server $PORTThat tiny local server script tells you a lot. There is no build step to nurse, no framework to keep in sync, and no database schema to migrate. Contributors can inspect the site with the same files that GitHub Pages will serve.
What it replaces
| Approach | Hosting model | Data model | Best fit | Tradeoff |
|---|---|---|---|---|
| Omniperf | Static pages on GitHub Pages | Manifest plus versioned JSON and previews | Historical robotics benchmarking | Narrow by design, but extremely legible |
| Generic observability dashboard | Server-backed SaaS or self-hosted stack | Live time-series database | Operational monitoring | More flexible, but overbuilt for frozen benchmark artifacts |
| Notebook plus CSV workflow | Local files and ad hoc scripts | Spreadsheets, plots, and screenshots | One-off analysis | Hard to compare across time and teammates |
| BI dashboard with a database | App server plus warehouse | Structured schemas and queries | Enterprise reporting | Heavier to maintain and less repo-native |
The trade is obvious once you see it. Omniperf gives up generality to gain clarity. It is not trying to replace Grafana or BI tools, because its job is smaller and more exact: make Isaac Lab benchmark history easy to browse, compare, and trust.
The larger lesson
The best tooling often looks plain because the complexity belongs in the data, not the interface. Here, the interface is intentionally thin so the real work stays visible: benchmark runs are artifacts, the manifest is the contract, and preview images are evidence.
That is why this repo feels more durable than flashy. It turns performance into something you can revisit later, not just admire once. For a robotics platform, that is the right kind of boring.