IC2-IC3: The SCADA Stack That Turns a Plant Into a Live Web Model
From Arduino firmware to Django APIs to a React-based flow diagram, this repository shows how industrial control can become visible, traceable, and teachable in one system.
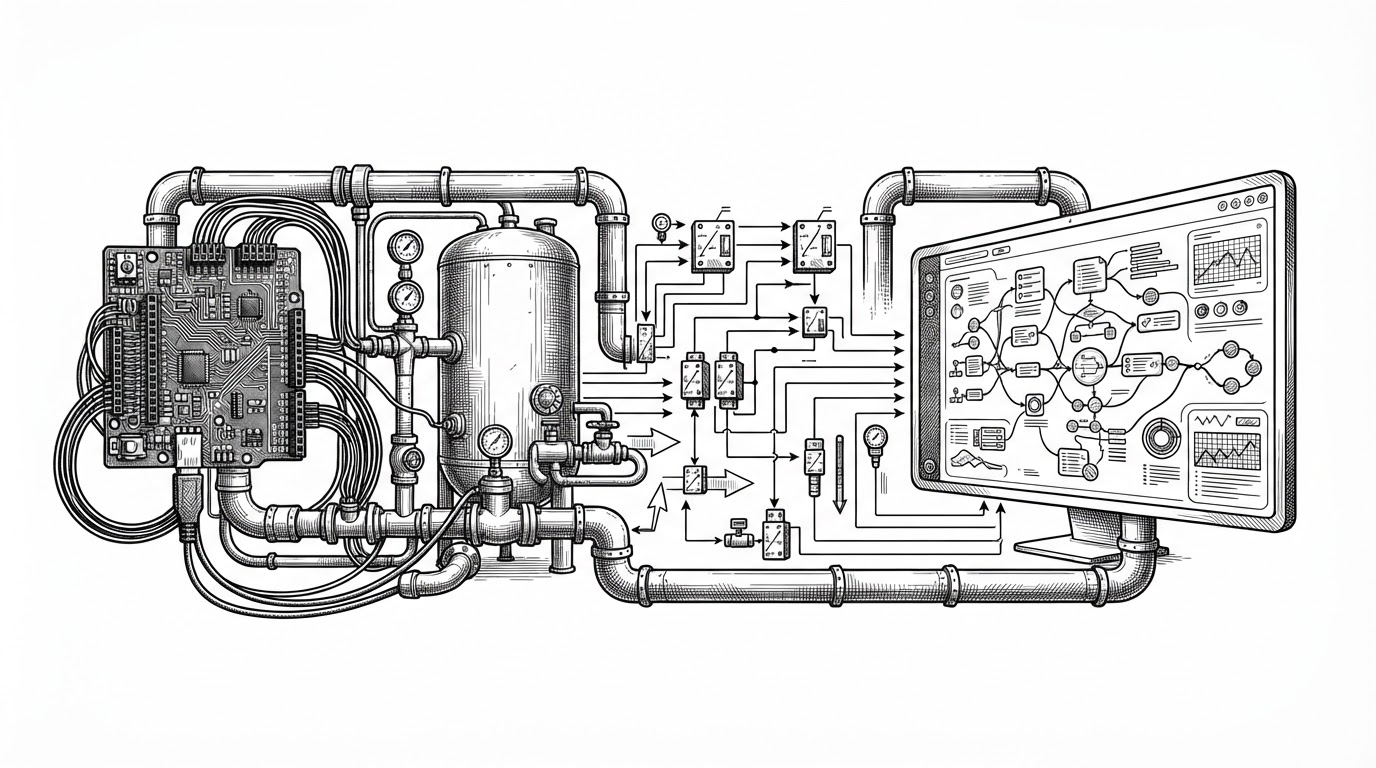
- IC2-IC3 treats industrial control as a single readable loop, not a collection of disconnected tools.
- Its main strength is the way plant state, backend records, and UI topology stay linked across layers.
- The project leans on derived state and auditability, which makes it feel designed for trust as much as for monitoring.
- The firmware, API, and React front end are modular enough to teach systems thinking, even if the stack is still clearly prototype-grade.
A Factory You Can Read Like a Graph
Most SCADA demos show data. IC2-IC3 shows relationships. A sensor changes, the backend evaluates the plant, the interface updates, and the operator sees the result as a live graph instead of a flat stream of numbers.
That matters because industrial software is usually fragmented. Control happens on the edge, records live in a separate system, and the interface is just a window. This repository tries to collapse those layers into one coherent model.
Why This Is More Than a Student SCADA Demo
The repository has student-project fingerprints, but it also shows stronger instincts than a typical Arduino-plus-dashboard build. The backend models are structured, the serializers are split by purpose, and the UI is built around explicit process state rather than ad hoc widgets.
That combination suggests the authors cared about boundaries. In practice, that means the system can be reasoned about in layers: device logic at the edge, operational truth in Django, and a visual model in React.
| Dimension | Traditional SCADA or legacy dashboard | IC2-IC3 |
|---|---|---|
| Deployment model | Often monolithic, vendor-tied, and hard to inspect | Split across firmware, Django, and React |
| UI representation | Panels, tables, and static alarms | Node graph that mirrors process topology |
| Auditability | Frequently bolted on later | Actions and system state are treated as records |
| State derivation | Mostly display-first | Plant status is computed from alarms and metrics |
| Maintainability | Commonly opaque and inherited | Modular firmware and explicit backend models |
Three Layers, One Process
The repository is organized around three named layers: ic1 for firmware, mysite for the Django backend, and scada-ui for the frontend. That is a useful separation because each layer has a different job and a different failure mode.
The firmware handles the physical world. The backend stores plant data, evaluates conditions, and exposes APIs. The frontend turns that state into a readable control-room view.
The backend does the real work of interpretation
In mysite/polls/models.py, Fabrica does more than store fields. Its state is derived from operational conditions such as alarms and performance metrics, which is a better SCADA pattern than passive CRUD.
# Conceptual pattern from the backend model
class Fabrica(models.Model):
    porcentaje_produccion = models.DecimalField(...)
    temperatura_promedio = models.DecimalField(...)
    alarmas_activas = models.IntegerField(default=0)
    estado = models.CharField(max_length=20)

    def actualizar_metricas(self):
        if self.alarmas_activas > 0:
            self.estado = "CRITICO"
        else:
            self.estado = "OPERATIVO"
        self.save()
That is the important shift. The system is not just storing what happened. It is computing operational truth from the current plant condition, which makes the data more useful to both operators and developers.
The UI Mirrors the Real Process
The most legible idea in the repository is ScadaFlowDiagram.tsx. Built with @xyflow/react, it turns the plant into a topology the operator can inspect, not just a dashboard they can scan.
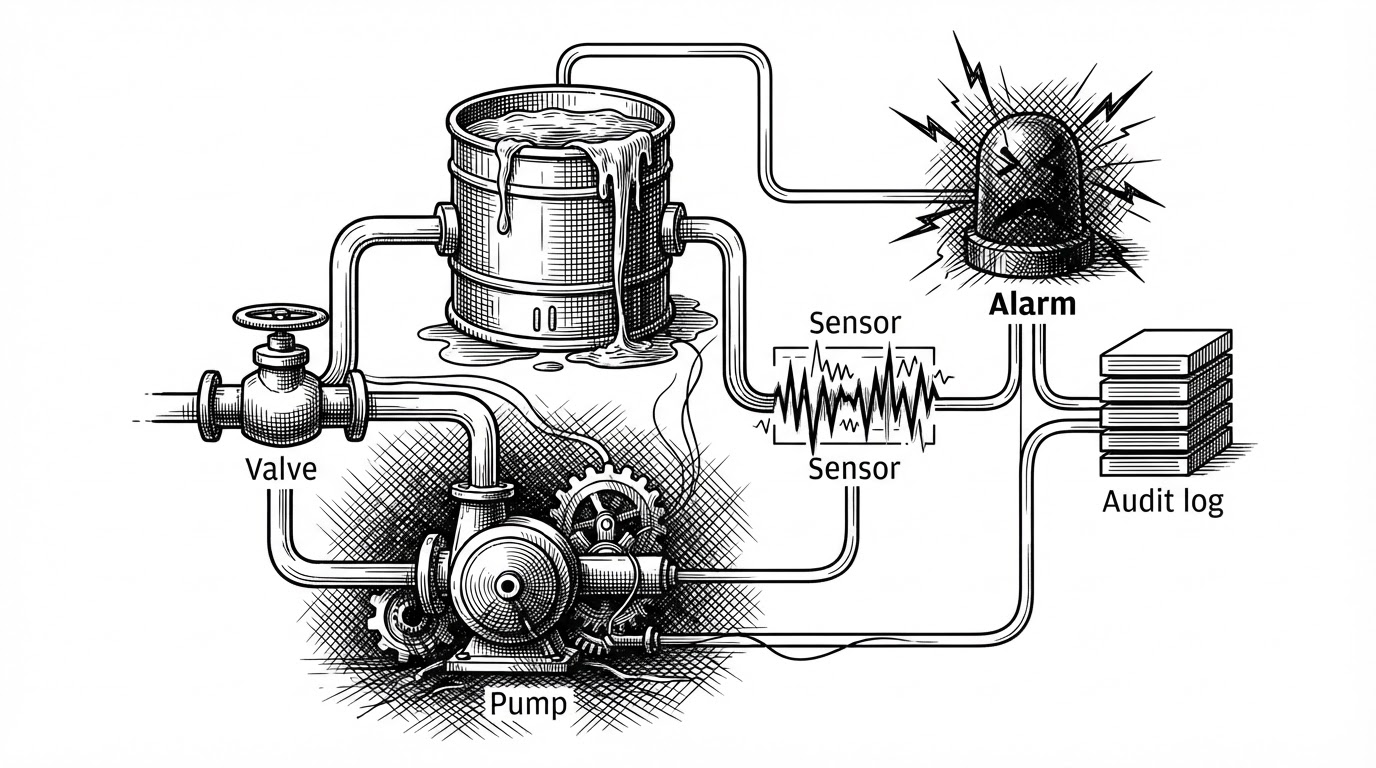
That matters because the interface makes causality visible. When a sensor changes, the backend updates. When the backend changes state, alarms shift. When alarms shift, the graph changes color and the audit trail records the action.
The UI also points at a bigger design principle: if the screen mirrors the system, the operator does not need to translate between different mental models. That saves time, but it also reduces ambiguity.
Hover, click, step, explain
The article plan calls for a mini-app that highlights one node, traces downstream effects, and steps through alarm propagation. That is the right instinct. A SCADA interface should teach the system by making state transitions easy to inspect.
Why the Firmware Layout Matters
The Arduino side is more disciplined than most hobby hardware projects. Splitting logic across files such as control_bombas.ino, funcion_de_nivel.ino, and bluetooth.ino keeps each concern separate.
That modularity matters because firmware gets messy fast. Once sensing, actuation, and communication are tangled together, the code becomes hard to test and harder to trust. This layout suggests the opposite instinct.
// File-level separation keeps the control path readable
// control_bombas.ino
// funcion_de_nivel.ino
// bluetooth.ino

void loop() {
  leerNivel();
  controlarBombas();
  manejarBluetooth();
}
What It Borrows, What It Replaces
IC2-IC3 does not need to replace enterprise SCADA to be interesting. Its value is as a modern teaching model: decoupled services, explicit state, visual topology, and audit-aware operations.
| Question | Legacy expectation | IC2-IC3 answer |
|---|---|---|
| Where is the truth stored? | Scattered across screens and controllers | In derived backend models and API records |
| What does the operator see? | A status board | A graph of the process itself |
| How are actions tracked? | Often through separate logs | Through audit-first application behavior |
| How easy is it to extend? | Usually tied to vendor patterns | Modular across firmware, backend, and UI |
| What is the learning value? | Procedure | System structure |
The strongest lesson is not that this repository is production-ready. It is that industrial systems become easier to build and reason about when the control path is modeled end to end.