click-to-component Turns React UIs Into Direct File Jumps
Option-click any element, recover the component that rendered it, and open the exact source location in your editor without leaving the browser.
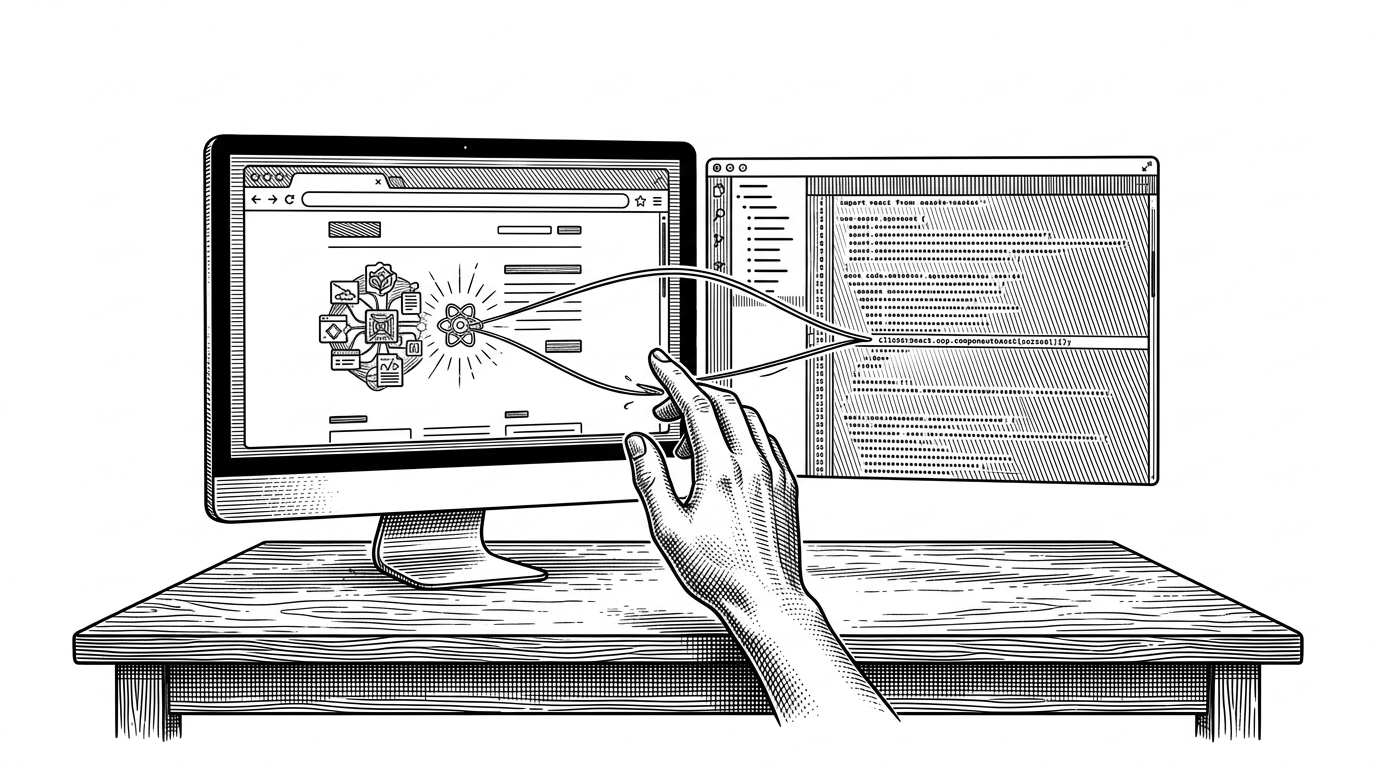

Option+Click React components in your browser to instantly open the source in VS Code
- click-to-component is a navigation tool, not a debugger, because it collapses the browser-to-source loop into one gesture.
- Its trick is to read React's dev-time breadcrumbs and turn private runtime data into editor URLs.
- The no-build design is part of the product, because the library stays light in development and disappears from production.
- The best comparison is not another inspector, but any slower workflow that makes you hunt for the file after you already found the UI.
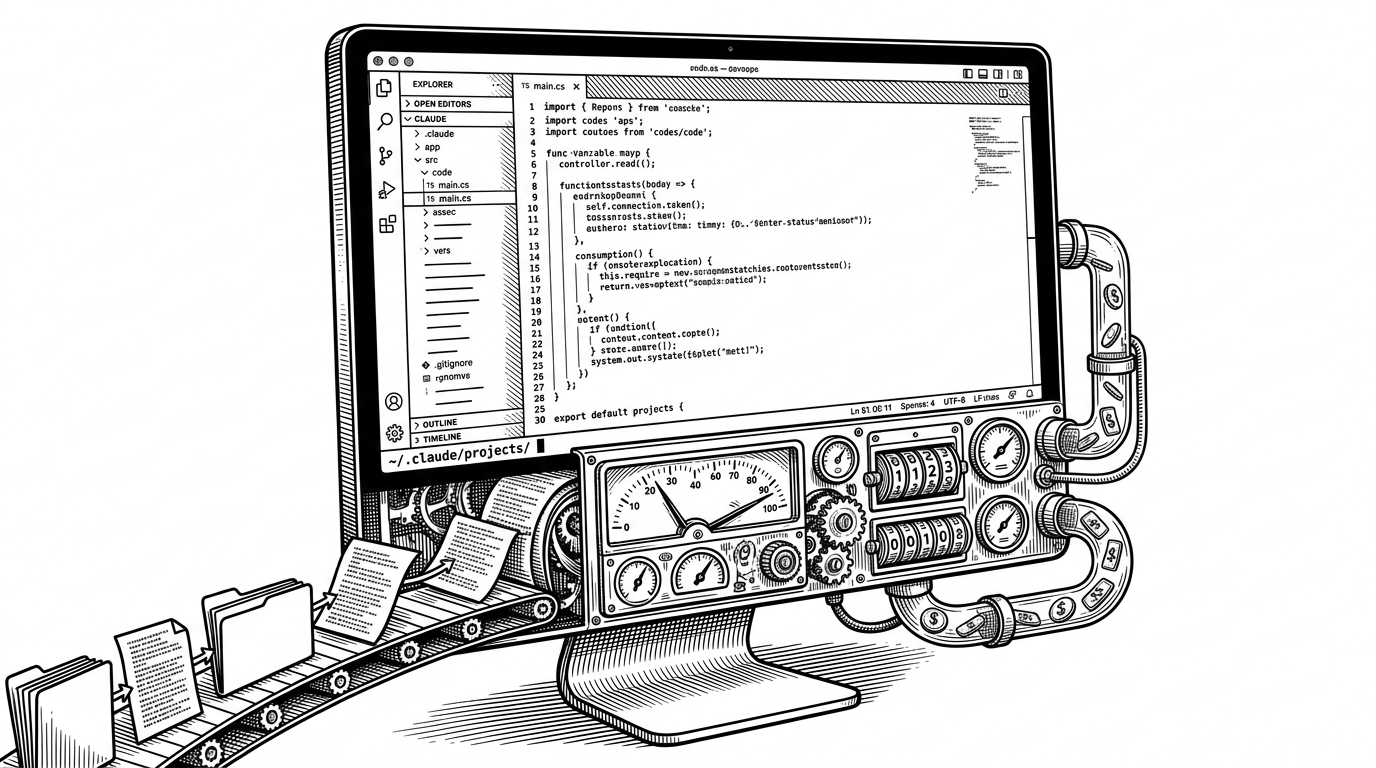
The first thing to understand about click-to-component is that it is not trying to be another React debugging pane. It is trying to erase a tiny but expensive ritual: see a component, search for it, open the file, then start editing.
That sounds small until you do it all day. In a large React app, the friction is not one dramatic failure. It is the repeated cost of context switching.
The browser gesture that collapses the gap
The workflow is almost too simple. Hold Option, click a UI element, and the editor opens the source file at the exact line and column that rendered it. Option-right-click adds a context menu, so the tool can be useful even when the clicked element is nested inside the thing you actually want to edit.
The trick: React already left breadcrumbs
The repo works because React dev builds already leak useful metadata. DOM nodes often carry private links back to Fiber, and React's JSX source transform can inject file information during development. click-to-component does not invent a new source map. It follows the breadcrumbs React already left behind.
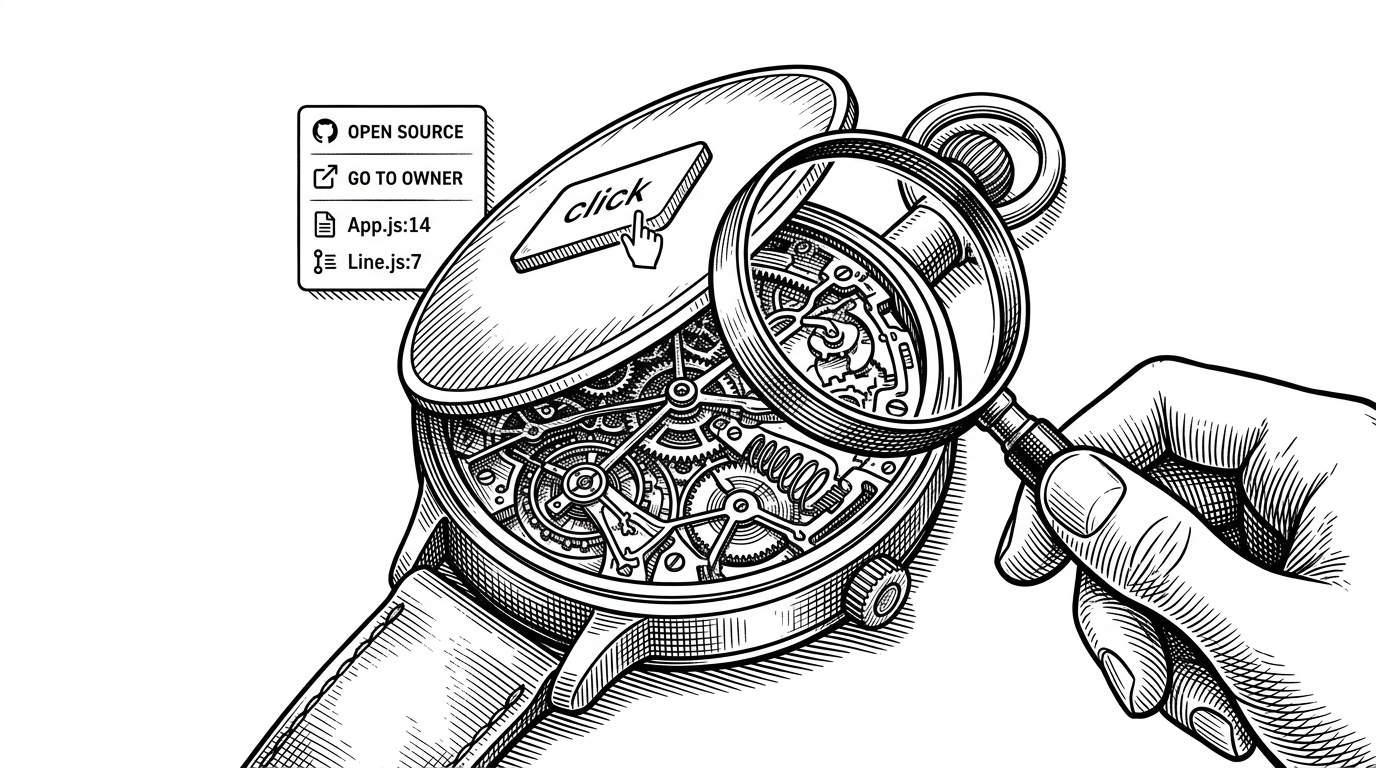
How it walks from DOM node to component
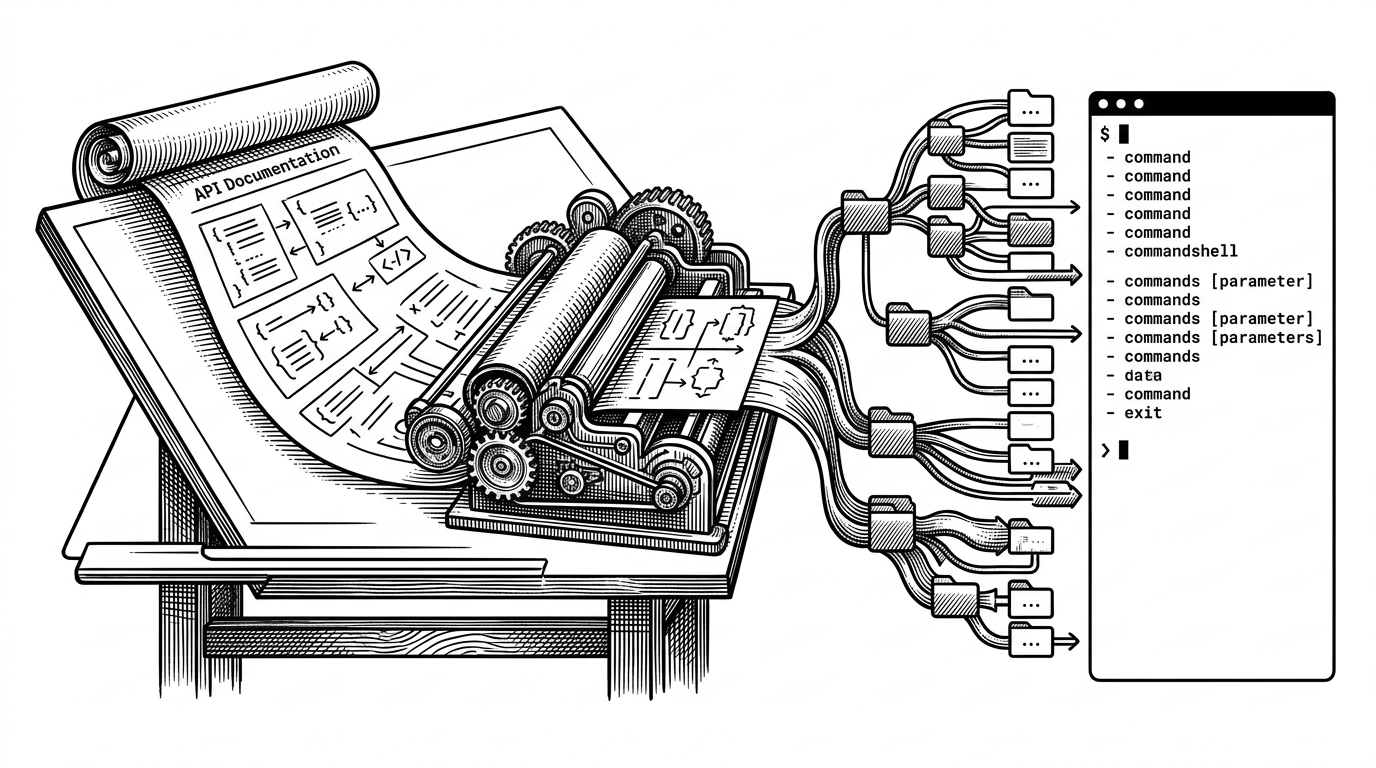
The resolution pipeline is the most interesting part of the repo. It tries a DevTools-style global hook first, then checks the root container, then falls back to probing DOM properties such as __reactFiber and __reactInternalInstance$. Once it has a Fiber instance, it can read _debugSource for file, line, and column data.
function resolveInstanceFromElement(element) {
  if (window.__REACT_DEVTOOLS_GLOBAL_HOOK__) {
    return fromDevToolsHook(element)
  }

  if (element._reactRootContainer) {
    return fromRootContainer(element)
  }

  for (const key in element) {
    if (key.startsWith('__reactFiber') || key.startsWith('__reactInternalInstance$')) {
      return element[key]
    }
  }
}

function getSource(instance) {
  return instance?._debugSource
}
The important detail is that the tool does not stop at the clicked node. It can walk upward through _debugOwner, which is why the context menu can show parents and not just the nearest leaf component.
Why the menu is more useful than a simple jump
A plain source jump would be enough for some workflows, but this project leans into ambiguity. The element you clicked is often not the component you want to edit. The menu gives you ancestry, props, and source details, so you can drill upward instead of accepting the first file the runtime hands back.
| Tool | Primary job | What you click | What you get | Shows ancestry? | Best use |
|---|---|---|---|---|---|
| React DevTools | Inspection and diagnosis | Component tree | Hooks, props, state, timing | Yes | Debugging behavior |
| Manual search | Navigation by memory | Nothing | A guessed file path | No | When the codebase is tiny |
| click-to-component | Source navigation | Rendered UI element | Exact file, line, and column | Yes | Editing the thing you just saw |
The no-build philosophy is part of the product
The library's design makes a point of staying light. The package ships as ES modules, uses htm in the library code, and exports a null component outside development so production builds do not carry the tool around. That is not an implementation detail. It is the thesis.
const ClickToComponent = process.env.NODE_ENV === 'development'
  ? require('./ClickToComponent').default
  : () => null

export default ClickToComponent
That choice keeps the package easy to adopt in React apps that already inject JSX source metadata. Next.js, Create React App, Vite, and Docusaurus can all participate without asking developers to restructure their workflow around a new toolchain.
Where it fits, and where it does not
The simplest way to frame the competitive set is this: React DevTools is for diagnosis, while click-to-component is for navigation. They overlap in runtime visibility, but they solve different jobs.
| Question | React DevTools | click-to-component |
|---|---|---|
| What is this component doing? | Strong | Secondary |
| Where is the source file? | Indirect | Direct |
| Can I jump from browser to editor? | Not the focus | Yes |
| Does it need a browser extension? | Yes | No |
| Does it work best in dev builds? | Yes | Yes |
| Does it help me edit faster? | Sometimes | Yes |
That distinction is the whole reason the project feels sharp instead of generic. It does one repeated job extremely well, then gets out of the way.
The deeper lesson is about latency, not convenience. Good DX tools do not add a new dashboard for you to admire. They remove the step between recognition and action.
click-to-component succeeds because it treats the browser as a starting point, not a destination. The UI is where the question appears. The editor is where the answer lives.