vscode-claude-status: The Utility Meter for Claude Code Inside VS Code
A local-first extension that reconstructs token usage, predicts rate-limit burnout, and makes Claude Code’s invisible costs feel like part of the editor itself.
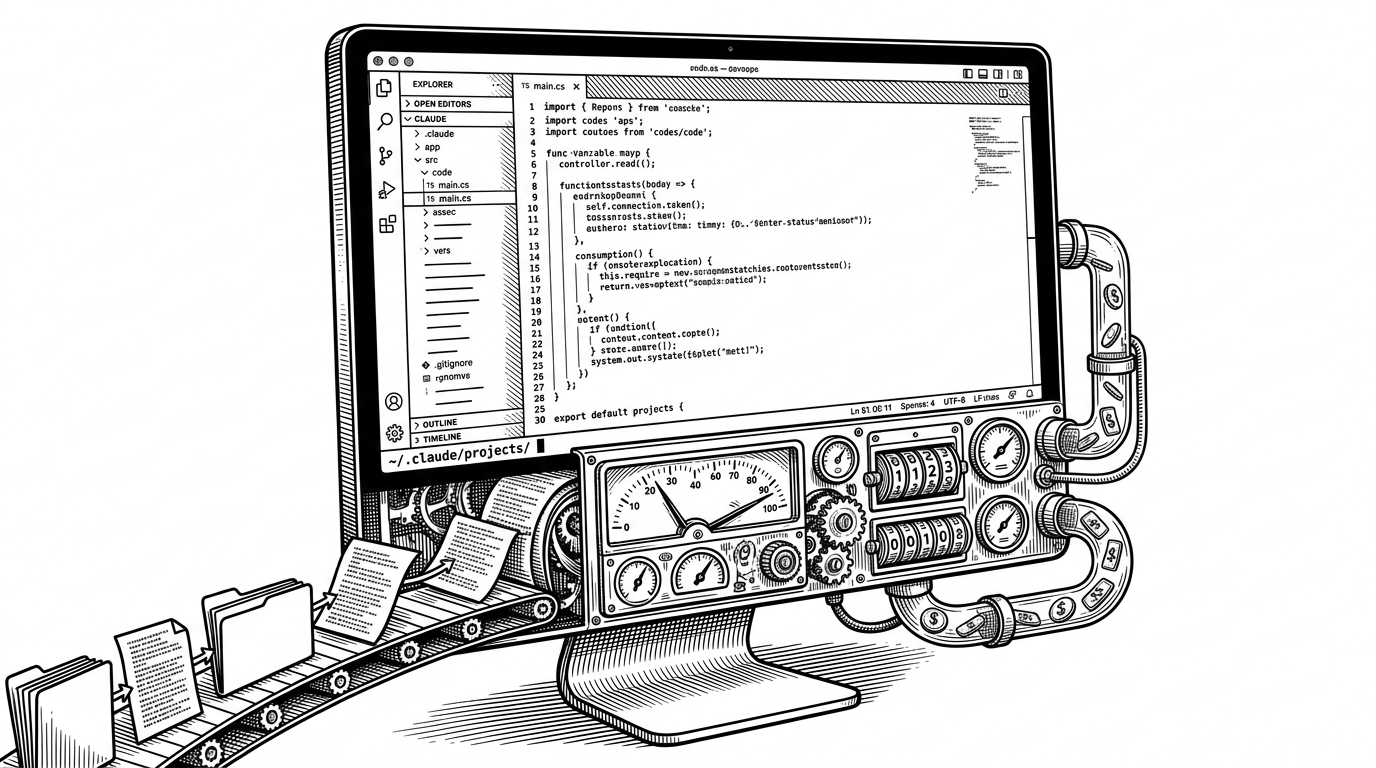
- vscode-claude-status turns Claude Code’s hidden usage trail into an in-editor utility meter, which makes spend and rate limits feel operational instead of abstract.
- Its main trick is local-first: it reconstructs cost from Claude Code JSONL logs before it ever reaches for the API.
- The extension stays cheap to run by querying rate limits only when recent activity suggests it is worth the call.
- Its real value is contextual visibility, because the editor becomes the control surface for Claude Code rather than a place you leave to check status.
Claude Code can feel frictionless until the bill and the limit arrive at the same time. Then the problem stops being cleverness and becomes interruption. `vscode-claude-status` is built for that gap: it keeps the meter in view while you keep typing.
The invisible bill problem
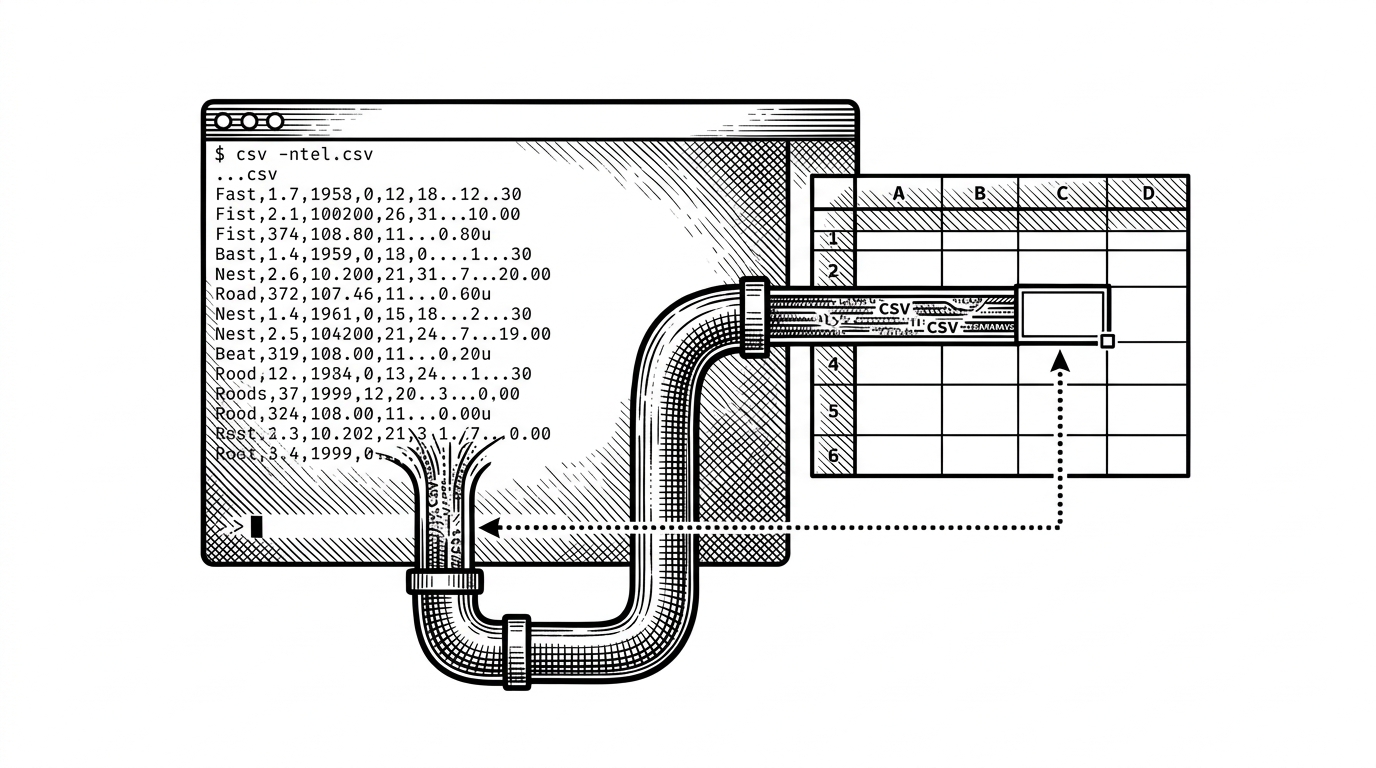
The project starts from a simple annoyance. If you want to know how much Claude Code has used, you usually have to leave the editor, run a command, or open a browser. That is exactly when awareness collapses.
Claude Code を使っていると「気づいたら使用量が上限に達していた」という経験、ありませんか? エディタで作業に集中しているとつい忘れてしまう使用量の確認。かといって別のコマンドやブラウザを開くのも手間です。 そこで、VS Codeのステータスバーに常時表示する拡張機能「vscode-claude-status」を作りました。
That framing matters because the pain is not theoretical. The extension is aimed at people who use Claude Code heavily enough that quotas, burn rate, and cost become part of daily workflow. The article’s basic claim is that usage needs to be visible where the work already happens.
How vscode-claude-status turns CLI logs into a live dashboard
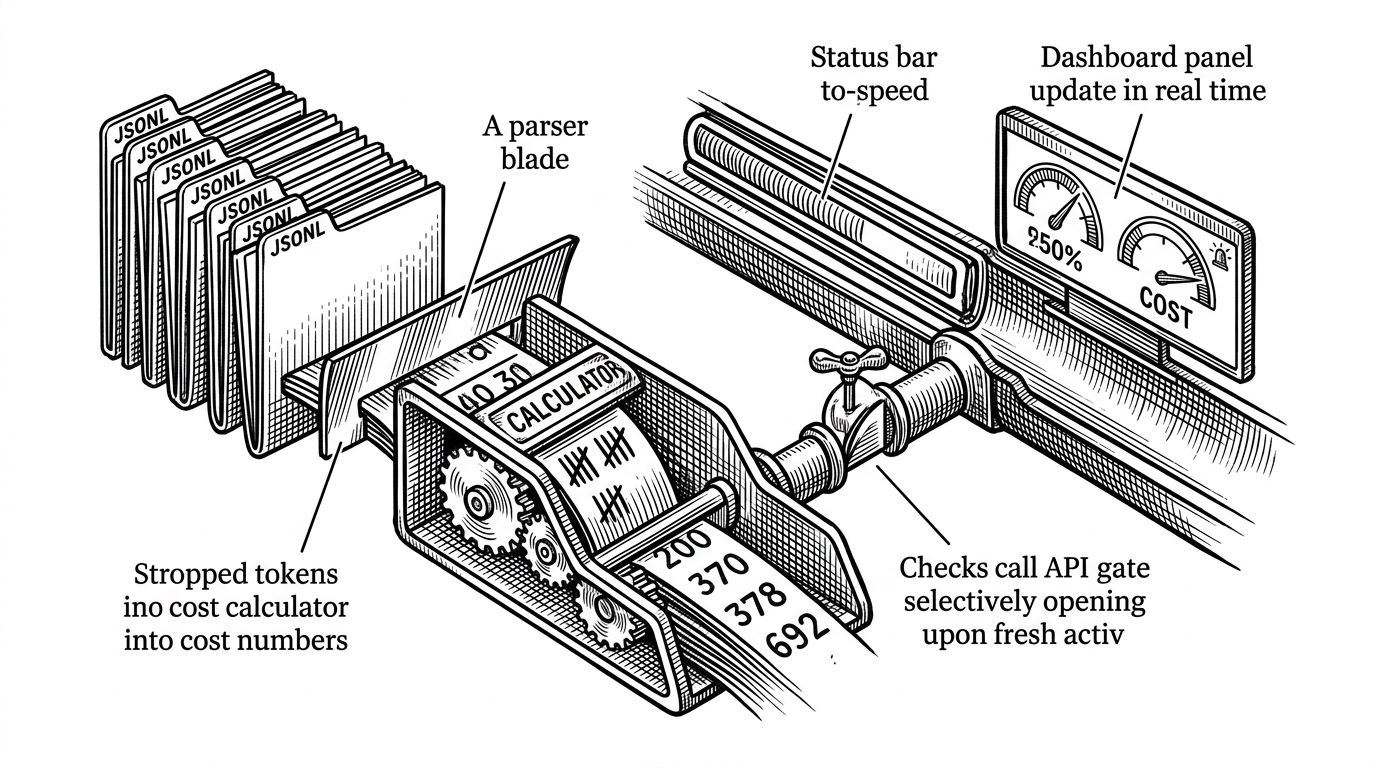
The key trick is embarrassingly practical. The extension reads Claude Code’s local JSONL history under `~/.claude/projects/`, filters assistant entries, extracts usage fields, and reconstructs cost from token counts and cache data. That means it can build a live dashboard from local evidence instead of waiting for cloud cooperation.
// Conceptual flow in the extension
const entries = readJsonlFiles('~/.claude/projects/**/*.jsonl');
const assistantTurns = entries.filter(e => e.type === 'assistant');
const usage = assistantTurns.map(e => e.message?.usage);
const cost = calculateCost(usage, pricing);

if (wasJsonlUpdatedRecently()) {
  await checkAnthropicRateLimits();
}

updateStatusBar(cost, prediction);
updateWebviewDashboard(cost, usage, prediction);
That last branch is the smart part. It keeps the extension from becoming an expensive watcher watching a watcher. The monitoring cost stays tiny because the API is only queried when recent activity suggests the answer will change.
The dashboard is doing three jobs at once
The extension splits itself cleanly across three surfaces. The status bar gives you a glanceable meter. The webview gives you the details. Notifications stop you before limits become a surprise.
| Surface | What it shows | Why it exists |
|---|---|---|
| Status bar | Percent Mode or Cost Mode at a glance | Constant awareness without leaving VS Code |
| Webview dashboard | Heatmaps, project costs, token breakdowns, predictions | Deep inspection when you want the story behind the number |
| Notifications | Budget caps and warning thresholds | Intervention before overspend or rate-limit pain |
Percent Mode and Cost Mode are not cosmetic variants. They serve different mental models. Some users want quota pressure in percentages, others want the bill in dollars. The extension supports both, which is a nice sign that it understands how people actually read these numbers.
The dashboard also reaches beyond raw usage. It adds project-level tracking, cache hit visibility, and predictions for when limits may be hit. That turns the panel from a passive counter into a planning tool.
Why the monitoring itself stays cheap
The extension’s discipline is easy to miss because it is the kind that prevents future bloat. It does not poll the cloud because it can. It only pays for a rate-limit lookup when local changes suggest the answer matters.
| Design choice | Effect |
|---|---|
| Local JSONL parsing | Cheap, private, and immediate usage reconstruction |
| Conditional API checks | Rate-limit context without constant polling |
| Event-driven updates | The UI changes when the data changes, not on a timer |
That economy is part of the product. A usage monitor that costs more than it saves would be self-defeating. This one is careful enough to avoid that trap.
The best part is the mental model
The deepest win here is not statistics. It is relocation. Claude Code no longer lives in some separate place you check occasionally. It becomes part of the editor’s instrument cluster.
That matters because developers think in context. If the meter sits next to the code, the cost of each assistant burst becomes legible at the moment of use. The tool does not just report history. It shapes behavior while work is still happening.
How it compares
| Project | Surface | Scope | Standout edge |
|---|---|---|---|
| vscode-claude-status | VS Code status bar and dashboard | Claude Code only | Project-aware, prediction-aware, local-first |
| tmux-claude-status | tmux status bar | Claude Code only | Terminal-native visibility |
| claude-usage-monitor | VS Code activity views and status bar | Claude.ai plus Claude Code | Broader scope, less editor-specific focus |
The interesting comparison is not which tool is universally better. It is which one matches the working style. `vscode-claude-status` wins by staying narrow and deeply integrated. It is built for people who live in VS Code and want Claude Code’s economics visible there, not elsewhere.
Why this project matters now
As agentic tools become normal, the valuable software around them will not just generate output. It will make limits, costs, and rhythms visible in context. That is what turns an opaque model dependency into something you can manage.
`vscode-claude-status` is a small project with a sharp idea. Claude Code already leaves the evidence. The extension just turns it into something a developer can act on.