`gascity-otel`: The Flight Recorder for AI Agents
A prewired OpenTelemetry stack for Gas City and Claude Code that turns prompts, tool calls, token burn, and agent lifecycles into something you can finally inspect.
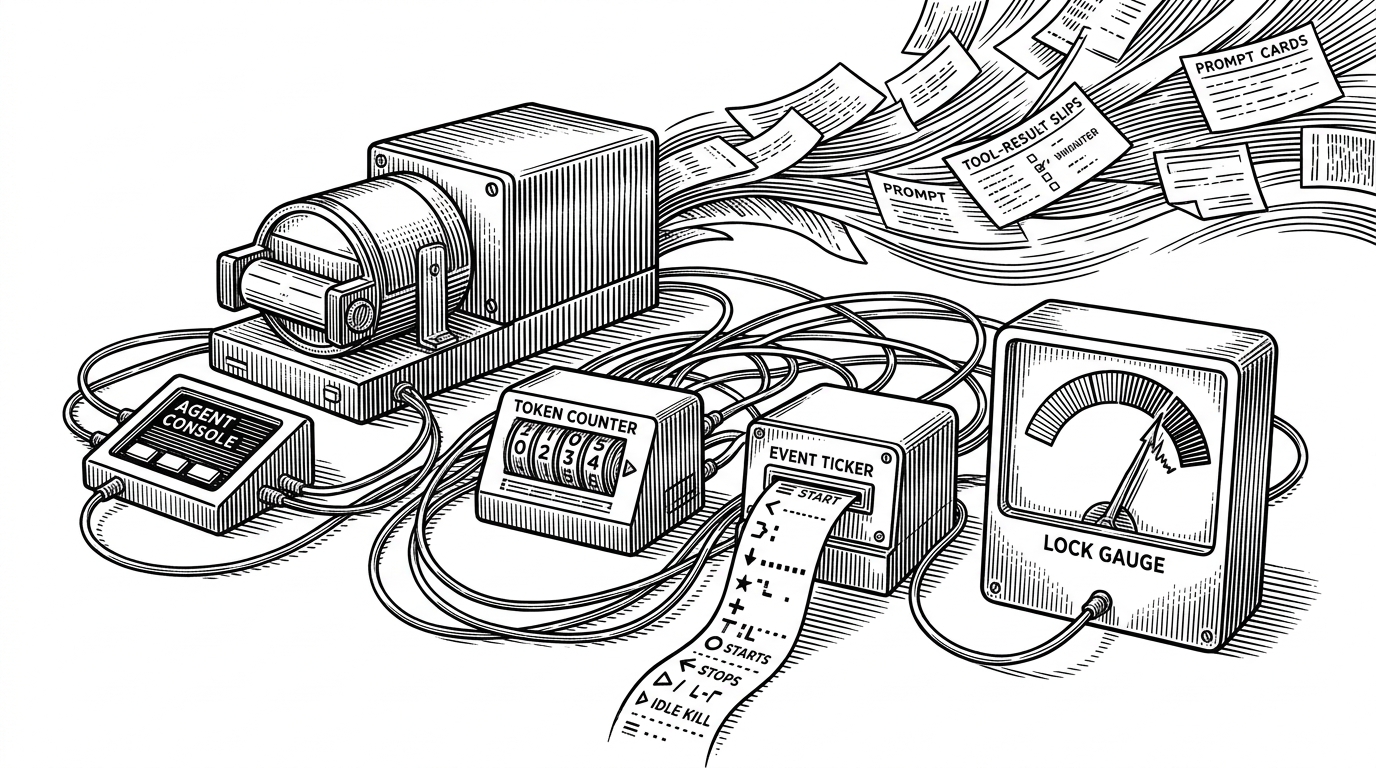
- `gascity-otel` treats prompts, tool calls, token usage, and lifecycle events as first-class signals, which makes AI agents legible in the same way servers became legible under observability.
- The clever part is not the dashboards but the telemetry bridge, which normalizes Gas City SDK, bead storage, and Claude Code into one OTLP pipeline.
- VictoriaMetrics and VictoriaLogs are not drop-in branding swaps here, because the stack uses them to simplify ingestion while keeping Prometheus-style querying habits intact.
- The project’s strongest warning is also its value proposition: the more useful the telemetry, the more likely it is to contain sensitive prompts, code, or PII.
The new thing to watch is not CPU
Traditional observability grew up around machines. CPU spikes, memory leaks, request latency, queue depth. Useful signals, but they assume the unit of work is a service that behaves more or less predictably.
AI agents break that assumption. They plan, call tools, retry, idle, get killed, and burn tokens while doing it. The most important failure modes are often hidden inside prompts, tool outputs, and lifecycle churn, which means the real system boundary is no longer the server. It is the agent’s work loop.
gascity-otel OpenTelemetry observability stack for Gas City â pre-configured VictoriaMetrics + VictoriaLogs + Grafana with dashboards.
What `gascity-otel` actually is
At a practical level, this repo is a preconfigured observability stack for gascity-otel's Gas City ecosystem and Claude Code telemetry. The root of the repo is lean: Docker Compose for orchestration, a setup script for environment wiring, and Grafana provisioning for datasources and dashboards.
That shape matters. Instead of asking every tool to become a custom integration, the repo uses OpenTelemetry as the common wire format. The result is a local stack that feels opinionated without being brittle.
The smartest part is the telemetry bridge
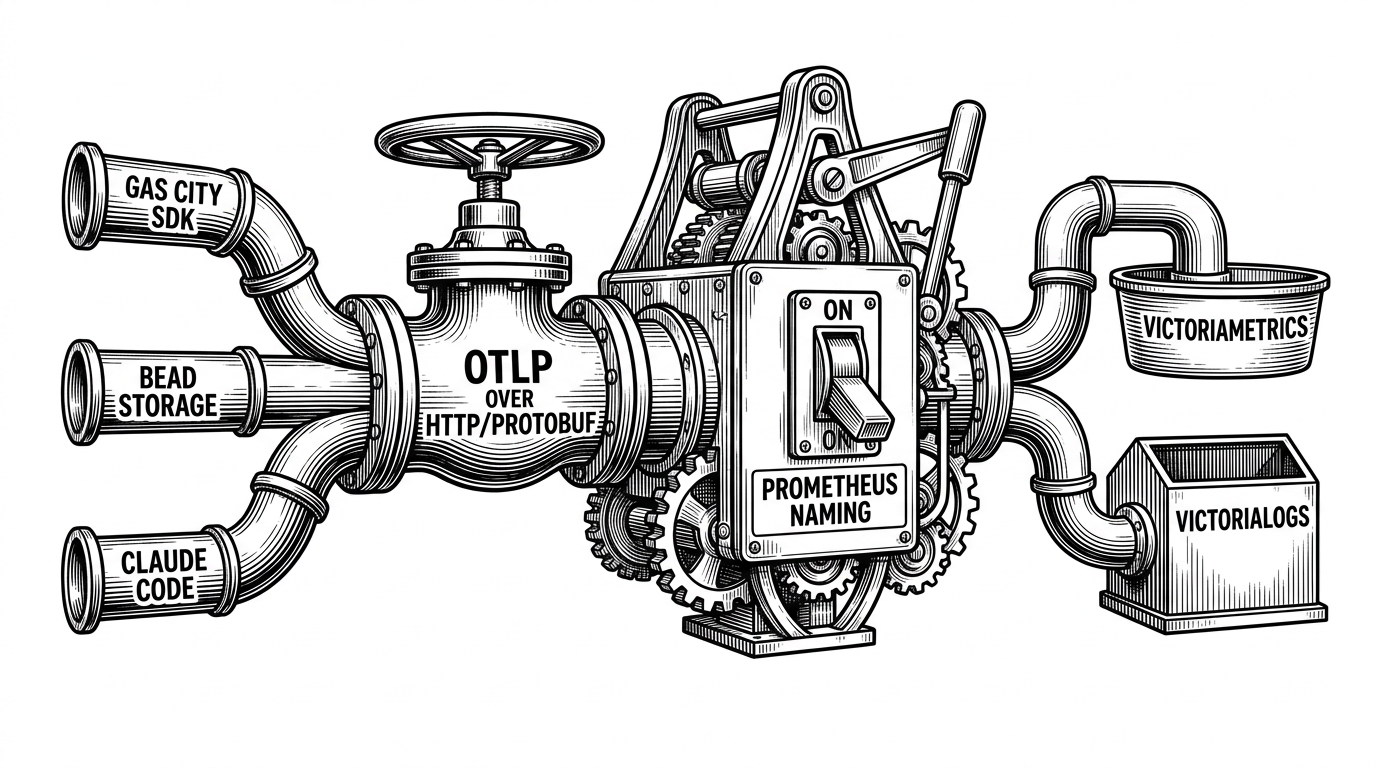
The center of gravity is `setup.sh`. Its job is boring in the best way: export standard OTEL variables, force `http/protobuf`, and make sure every source speaks the same protocol before the data reaches storage. That is what turns the stack from a bundle of services into a usable observability system.
The privacy tradeoff is built into the same bridge. The more helpful the telemetry gets, the more likely it is to include code, prompts, and other sensitive context. That is not a footnote here. It is part of the design.
The dashboards are about agent economics, not server health
The dashboards shift the reader’s attention from machine metrics to agent economics. Instead of CPU and RAM, you get token input and output, idle kills, lifecycle events, circuit breaker trips, and lock wait times. That is a different model of operations.
| Signal | What it tells you | Why it matters |
|---|---|---|
| Token totals | How much work an agent is doing and how expensive it is | Tokens are the new unit of cost for LLM systems |
| Agent starts and stops | How often agents spin up, exit, or get culled | Agent work is ephemeral and needs reconciliation |
| Idle kills | Which sessions were terminated for inactivity | Idle behavior can signal broken workflows or wasted compute |
| Circuit breaker trips | Where storage or service limits are being hit | Breakers expose reliability boundaries before users do |
| Lock wait times | Where bead storage is contended | Concurrency problems show up as coordination pain, not just latency |
That table is the point. The repo is not trying to teach you how healthy infrastructure looks. It is teaching you how healthy agent labor looks.
Why VictoriaMetrics and VictoriaLogs change the shape of the stack
The storage choice is deliberate. VictoriaMetrics handles metrics with Prometheus compatibility and native OTLP support. VictoriaLogs handles logs without dragging in the usual Loki or Elasticsearch mental model. Grafana sits on top and queries both in ways that feel familiar enough to adopt quickly.
| Dimension | Default instinct | This repo |
|---|---|---|
| Metrics backend | Prometheus | VictoriaMetrics |
| Logs backend | Loki or ELK | VictoriaLogs |
| Telemetry protocol | Mixed exporters and adapters | OTLP over HTTP/Protobuf |
| Setup style | Assemble everything by hand | Prewired local stack |
| Best fit | General-purpose observability | Agent telemetry and local experimentation |
| Query habit | New syntax and new mental models | Prometheus-style naming preserved where useful |
This is not just brand substitution. The stack narrows the blast radius of observability by making the whole path more opinionated and more coherent. Fewer moving parts. Fewer translation layers. More signal where the agent actually lives.
The tradeoff nobody should skip
The same observability that makes agents legible can also make them dangerously exposed. Prompts, tool results, and telemetry metadata can easily contain PII, proprietary code, or other sensitive data. If you instrument the thought process, you own the privacy policy too.
That tension is why this repo matters. It does not pretend agent observability is free. It shows that making AI systems accountable requires making them more visible, and visibility always has a cost.
Why this repo matters even if you never run it
`gascity-otel` is a small repository with a big signal. It sketches what observability looks like when software is not just serving requests, but performing work on your behalf. In that world, prompts, tool results, token ratios, reconciliation events, and storage health become the new operational substrate.
That is the lasting idea here: the future of monitoring is not only about machines. It is about making agentic labor auditable without making it invisible to the people who need to understand it.