agentic-visualization: PaperVizAgent: The Multi-Agent Studio That Tries to Make AI Draw Like a Researcher
Google Research breaks scientific visualization into retrieval, planning, styling, generation, and critique, then loops back until the chart earns publication-grade confidence.
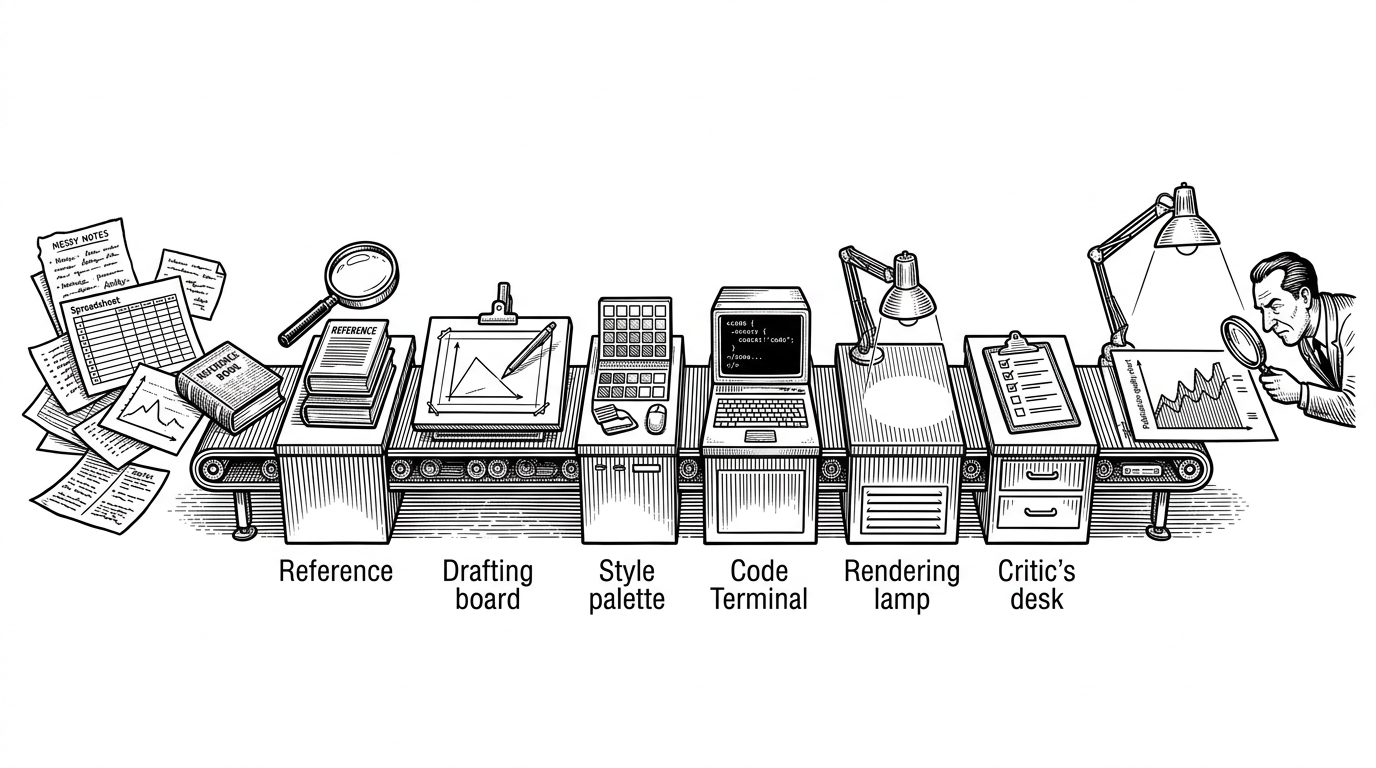
- PaperVizAgent treats scientific visualization as an editorial workflow, not a one-shot generation task.
- Its core trick is a closed loop that grounds, generates, inspects, and refines until the output is ready to ship.
- A shared global TODO list keeps the specialists aligned, which is how the system avoids drifting away from the user’s original intent.
- The project is narrower than a general agent platform, but deeper in the place that matters: publication-quality visuals.
The chart that knows when it still looks wrong
Most chart generators stop when the code runs. PaperVizAgent keeps going. It renders a draft, looks at the result, and sends the work back if the output still has problems like overlap, clipping, or weak readability.
That is the real story here. The repo does not treat visualization as a prompt problem. It treats it as an editorial problem, where a visual has to survive critique before it counts as finished.
Acting like a creative team of specialized agents, it transforms raw scientific content into publication-quality diagrams and plots through an orchestrated pipeline of Retriever, Planner, Stylist, Visualizer, and Critic agents.
From one prompt to an assembly line
The repository’s architecture is built around specialization. Instead of asking one model to do everything, it breaks the job into a chain of agents with different responsibilities: retrieval, planning, styling, generation, and critique.
That division of labor matters because scientific visuals fail in different ways. A model can understand the request, yet still choose the wrong example, map the data badly, or produce a plot that looks technically valid but visually sloppy.
The global TODO list is the real backbone
The shared memory move is easy to miss, but it is the part that keeps the whole system coherent. The query analyzer writes a global_todo_list, and every downstream agent keeps checking its work against that contract.
That reduces drift. Without a stable target, multi-agent systems can wander. With a shared checklist, each specialist can optimize its own step while still staying accountable to the same intent.
# simplified shape of the workflow
query = user_request()
todo_list = query_analyzer(query)
references = retriever(todo_list)
plan = planner(todo_list, references)
styled_spec = stylist(plan, references)
chart_code = visualizer(styled_spec)
image = render(chart_code)
score, feedback = critic(image, todo_list)
if score < threshold:
    chart_code = refine(chart_code, feedback, todo_list)
Why retrieval beats hallucinated chart logic
The retrieval step is the anti-hallucination move. Instead of trusting the model to invent a good plotting pattern from scratch, the system pulls in grounded examples and uses them as a bias toward valid, familiar structure.
That is especially useful in visualization work, where tiny mistakes matter. A plot can be semantically correct and still be unusable if the axis formatting, marker choice, or layout logic is off.
| Approach | Strength | Weakness | Best use case | Why this repo is different |
|---|---|---|---|---|
| One-shot LLM chart generation | Fast to try | Often brittle and style-blind | Quick drafts | PaperVizAgent adds retrieval and critique before it calls the job done |
| General-purpose multi-agent builder | Flexible across tasks | Not tuned for publication visuals | Building custom agent flows | PaperVizAgent is specialized for scientific illustration quality |
| Traditional script-first workflow | Precise and reproducible | Requires manual iteration | Analyst-led charting | PaperVizAgent automates the editorial passes around the script |
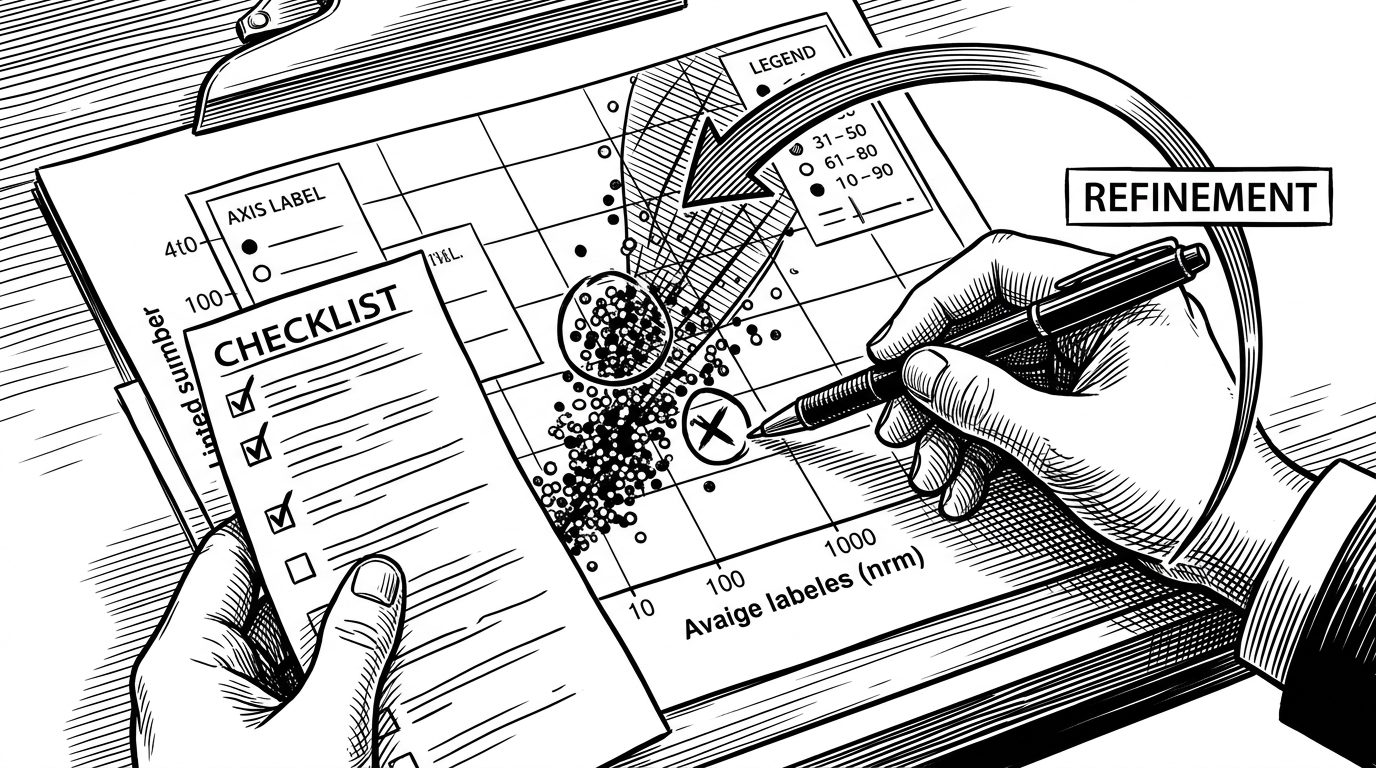
How the visual evaluator closes the loop
This is where the system stops behaving like a chart bot and starts behaving like a reviewer. The evaluator is not asking whether the code executed. It is asking whether the artifact communicates clearly.
That catches the failures people remember from real work. A label that barely fits. A legend that fights the data. A composition that technically answers the prompt but would never make it into a paper or slide deck.
| Layer | What it optimizes | What it misses | What PaperVizAgent adds |
|---|---|---|---|
| Code execution | Correct syntax and runtime | Readability and aesthetics | A visual critic that inspects the rendered result |
| Single-agent generation | Speed | Context drift and fragile style choices | Specialists with separate responsibilities |
| Generic agent orchestration | Flexibility | Weak quality gates | A publishability threshold and refinement loop |
What makes it more than a chart bot
The strongest way to understand PaperVizAgent is as a publication workflow encoded in software. It combines inference, retrieval, design judgment, and revision into a single system that keeps asking whether the output is actually worthy.
That is a narrower ambition than a general agent platform, but it is also a sharper one. The repo is not trying to make every kind of visual artifact. It is trying to make scientific visuals that can survive editorial scrutiny.
Where it sits in the landscape
Compared with general agent builders, PaperVizAgent is less flexible but more opinionated. Compared with plain code-generation tools, it is slower but harder to fool. Compared with traditional visualization scripts, it removes a chunk of the manual back-and-forth that turns drafts into publishable figures.
| Project | Primary focus | Iteration style | Differentiator |
|---|---|---|---|
| PaperVizAgent | Publication-quality scientific visuals | Closed-loop critique and refinement | Specialized agents plus visual evaluation |
| General agent builders | Broad workflow composition | User-designed | Platform breadth |
| One-shot chart generators | Fast output from text | Single pass | Speed |
| Script-first plotting | Manual control and precision | Human-led | Determinism |