HyperCoast: Slicing the Infinite Data Cube
How a specialized Python stack is turning NASA’s hyperspectral firehose into an interactive, browser-based laboratory for coastal science.

Add support for acolite
- HyperCoast transforms the browser into a web-native spectrometer by linking 2D spatial coordinates to 1D spectral plots in real time.
- The library uses Xarray and lazy loading to manage massive multidimensional data cubes without exhausting system memory.
- A unified API abstracts NASA’s complex authentication and file structures into a single-line search and streaming workflow.
- Integration with PyVista enables researchers to visualize and slice hyperspectral data as true 3D volumes across the electromagnetic spectrum.
The Pixel is a Prism
Most web mapping libraries stop at the X and Y axes. You click a pixel on a satellite image, and the system returns a fixed color value. HyperCoast breaks this flat paradigm by piercing the Z-axis of the electromagnetic spectrum. It turns the browser into a web-native spectrometer.
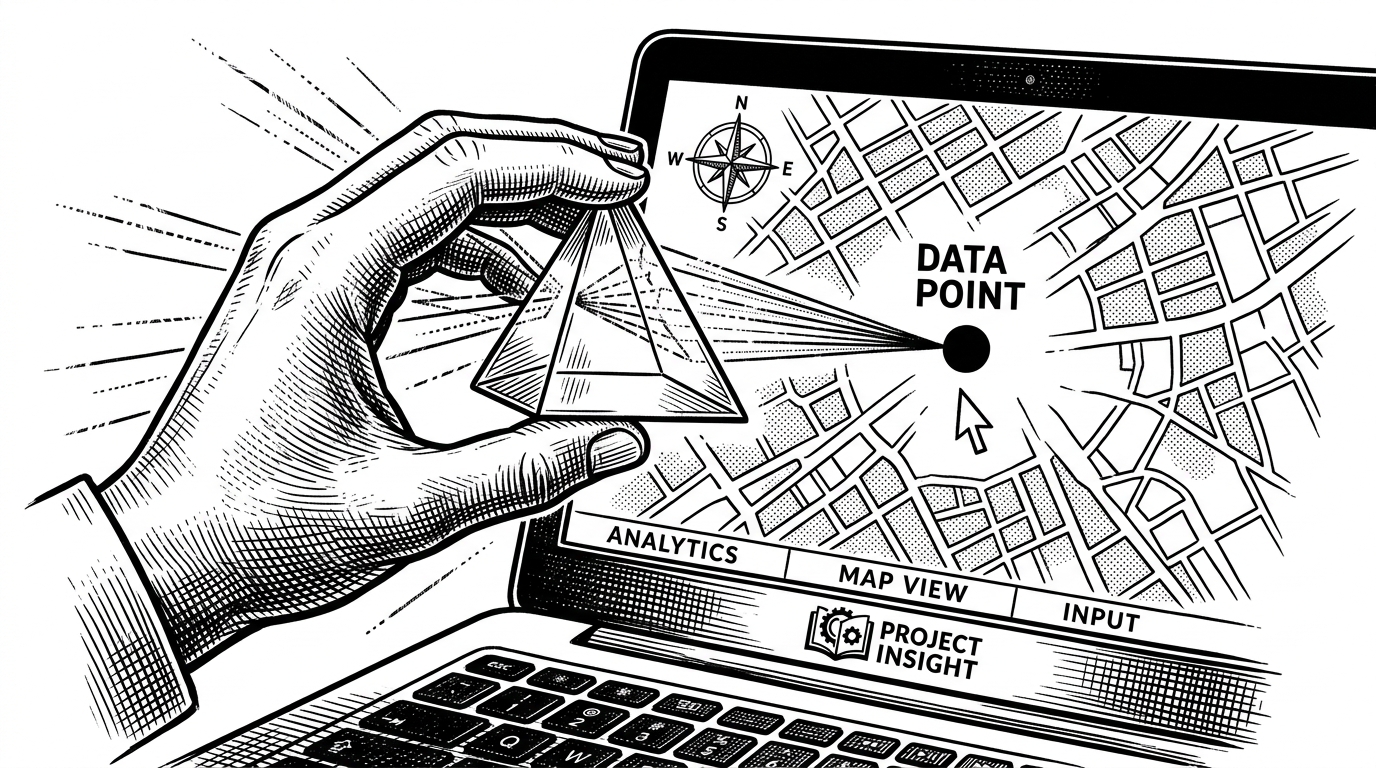
The core interaction centers around the SpectralWidget. When a researcher clicks a coastal coordinate on a Leafmap instance, HyperCoast does not just read the surface color. It instantly drills through hundreds of overlapping data layers to extract a complete chemical fingerprint of that exact location. It links a 2D spatial coordinate to a 1D spectral plot in real time.
This transforms a task that traditionally required downloading gigabytes of specialized files into a fluid, exploratory browser experience. The "Aha" moment is not the underlying math. It is the ability to visually sweep across a lagoon and watch the spectral signature shift as the water transitions from sediment-heavy runoff to a dense algal bloom.
Beyond the RGB Illusion
Standard satellite imagery operates on a comforting illusion. It captures broad bands of Red, Green, and Blue light to create a picture that makes sense to the human eye. For terrestrial mapping, this is often sufficient. For coastal aquatic science, it is practically useless.
Coastal waters are optically complex. Suspended sediments, dissolved organic matter, and specific phytoplankton species all absorb and reflect light in subtle, overlapping ways. To distinguish toxic cyanobacteria from harmless green algae, scientists need hyperspectral data. Instead of three wide bands of light, sensors like NASA's PACE (Plankton, Aerosol, Cloud, ocean Ecosystem) capture hundreds of narrow, continuous optical bands.
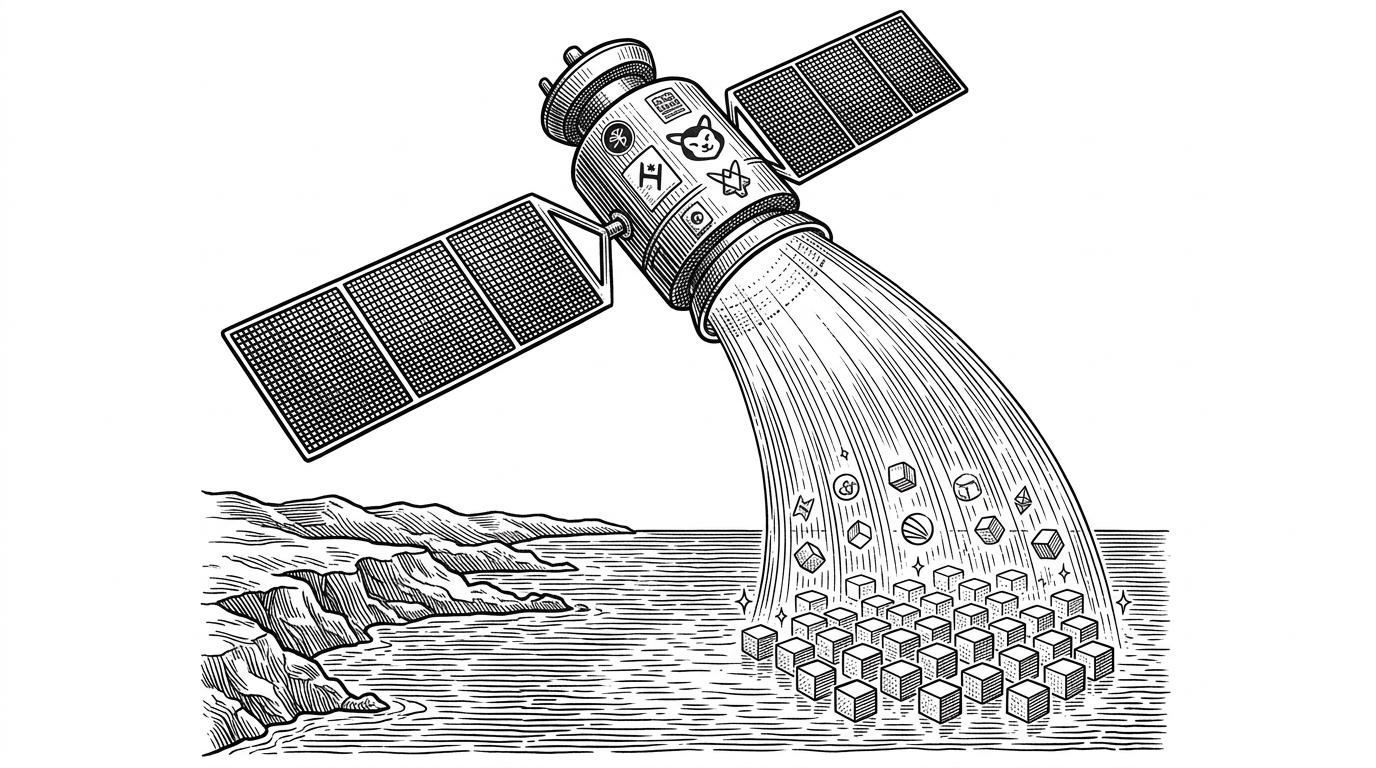
This produces the "Data Cube" problem. A single hyperspectral image is a massive, three-dimensional array. Traditional GIS software chokes on these files. The data is too heavy to load into memory and too complex to render on a standard map canvas. HyperCoast solves this by normalizing the data into xarray structures, allowing for lazy loading and out-of-core computation before the data ever reaches the visualization layer.
Engineering the "Cloud-to-Crank" Pipeline
The true bottleneck in Earth observation is rarely the algorithm. It is the data access pipeline. NASA data products are notorious for their complex internal structures (HDF5 or NetCDF files) and strict authentication gateways. HyperCoast abstracts this messy reality into a unified API.
The library extends the popular leafmap package via inheritance. The primary Map class in HyperCoast is a direct subclass of leafmap.Map. This means any existing IPyLeaflet functionality is natively available, augmented by hyperspectral-specific methods.
import hypercoast
m = hypercoast.Map()

# Search and authenticate with NASA Earthdata in one line
results = m.search_pace(bounding_box=[-90, 20, -80, 30])

# Stream directly to the map and initialize the spectral inspector
m.add_pace(results[0])
m.add_spectral_widget()
m
To handle the specific idiosyncrasies of different satellite missions, HyperCoast uses a provider-specific module pattern. Files like pace.py and emit.py handle the complex translation of raw sensor coordinates into orthorectified geographic coordinates. The library continually evolves to handle advanced scientific processing steps directly in the pipeline.
The Third Dimension of Water
Because hyperspectral data represents a volume of information, projecting it onto a flat map inevitably leaves data behind. HyperCoast addresses this by integrating PyVista to render data as a true 3D volume.
This allows for "slicing" through wavelengths. Users can generate 3D voxels from 2D satellite swaths. By moving along the Z-axis, researchers can visualize how spatial features change across the electromagnetic spectrum. A river plume that looks identical to surrounding water in the visible spectrum might become starkly visible when sliced at the near-infrared frequency.
From Desktop Silos to Open Geos
For two decades, hyperspectral analysis meant purchasing expensive desktop software or writing bespoke, fragile Python scripts. HyperCoast shifts this workload into the modern, cloud-native geospatial ecosystem.
| Capability | Legacy Hyperspectral Tools | HyperCoast |
|---|---|---|
| Data Access | Manual download, local extraction | API stream via NASA Earthaccess |
| Visualization | Static 2D plots and local GUIs | Browser-based 2D maps and 3D PyVista volumes |
| Data Structures | Proprietary formats or raw NumPy arrays | Standardized Xarray multidimensional datasets |
| Primary Environment | Desktop Application (ENVI) or CLI | Jupyter Notebooks and Web Applications |
By standardizing the data ingestion layer and providing high-level interactive widgets, HyperCoast lowers the barrier to entry for complex coastal science. It is not just about making pretty pictures of the ocean. It is about building the infrastructure required to monitor the changing chemical reality of the planet's coastlines in real time.
Sources: Codebase architecture and changelog data from the HyperCoast GitHub repository; API patterns from the official HyperCoast documentation.