skyview: SkyTrack: The Flight Tracker Where the Backend Takes the Blame
A real-time aviation dashboard that turns noisy ADS-B state vectors into a calm, map-first experience by caching, normalizing, and shielding the UI from upstream failure.
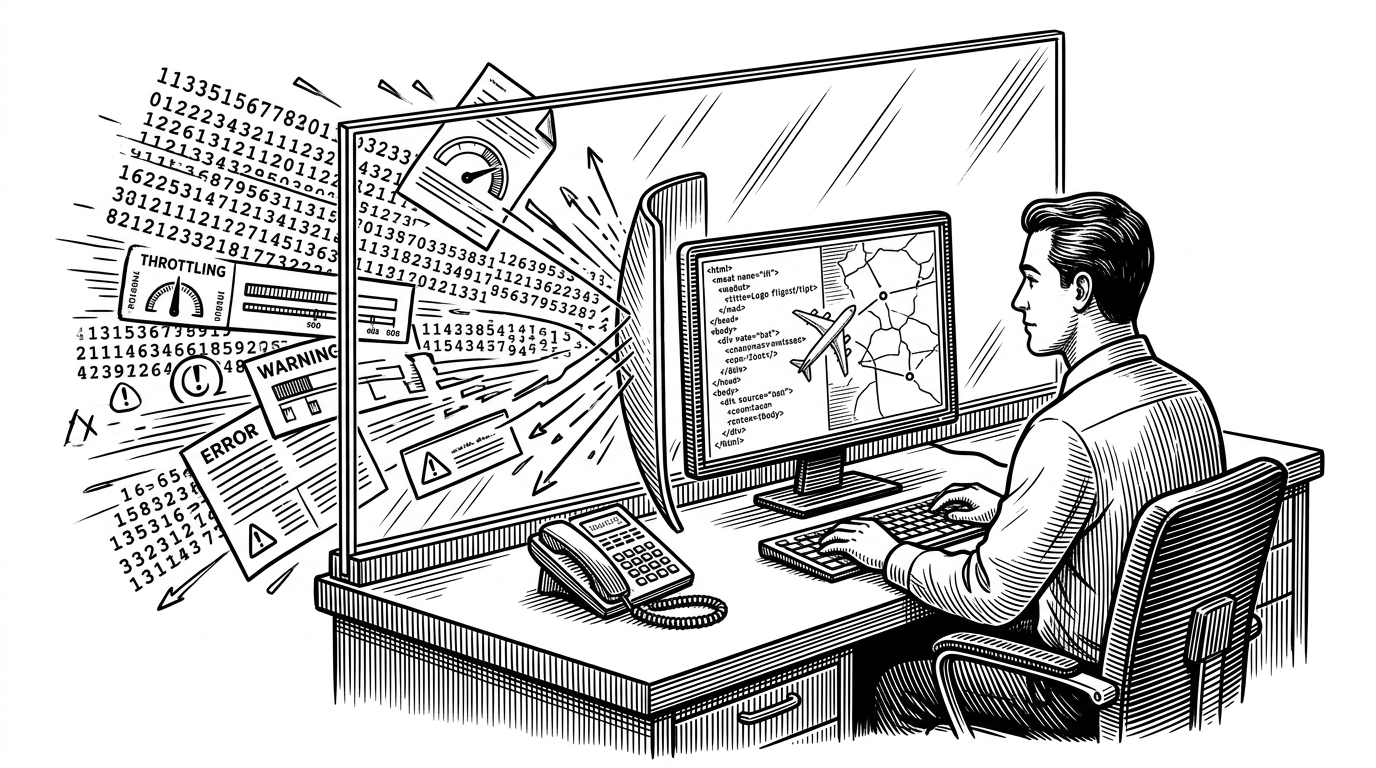
- SkyTrack’s strongest idea is architectural: it treats unreliable aviation data as a systems problem, not a UI problem.
- The server does the hard work by caching, normalizing, and falling back to stale data when the upstream API fails.
- The frontend stays responsive because polling, aborts, and map updates are separated into narrow, predictable hooks.
- The project feels polished because it adds memory and motion to a stateless feed without making the user feel the machinery.
Most flight trackers show you a map and hope the data cooperates. SkyTrack does the opposite. It assumes the live feed will be noisy, rate-limited, and occasionally wrong, then builds a protective layer around it so the user never has to care.
That is the part worth noticing in Kaushar26/skyview. The project behaves less like a demo and more like a miniature production system: request caching, graceful fallback, normalized payloads, and a frontend that stays simple because the server has already done the hard work.
The map is the least interesting part
This project is in its early stages. Contributions and feedback are welcome.
That README line reads modestly, but the code says something sharper. The interesting move here is not drawing aircraft over a basemap. It is deciding that live aviation data should be treated like an unreliable dependency and wrapped accordingly.
That changes the product. Instead of letting the browser talk directly to OpenSky and fail in public, SkyTrack routes requests through a backend-for-frontend layer that can cache, normalize, and recover. The result feels live without pretending the source is perfect.
How SkyTrack protects the UI from a brittle API
| Pattern | Data flow | Failure behavior | UI complexity | User experience |
|---|---|---|---|---|
| Direct client fetch | Browser calls OpenSky directly | Rate limits and API errors surface immediately | High, because every component handles its own failures | Jittery and fragile |
| SkyTrack middleware + cache | Browser calls Express, Express calls OpenSky | Server can reuse cached data or normalize responses | Lower, because the frontend receives shaped data | Calm and predictable |
| SkyTrack with stale fallback | Browser gets the last useful version when the source breaks | 429 and 502 become degraded service instead of a dead end | Still low, because failure stays centralized | Feels live even under stress |
The backend centers on `openSkyService.js`, where an in-memory `Map` acts as the first line of defense. If the same bounding box was just requested, the server can answer without hitting OpenSky again. If the upstream API rejects the call, the server can still return stale data instead of collapsing the whole experience.
That is a production pattern, not a portfolio flourish. It is also the right one for this problem. Real-time data is only useful if the interface keeps its composure when the source does not.
Raw state vectors become readable flight objects
OpenSky does not hand back cozy JSON with friendly field names. It returns dense state vectors, which are compact for machines and unfriendly for humans. SkyTrack’s `flightMapper.js` turns that into something you can actually build a product on.
const [
  icao24, callsign, originCountry, timePosition, lastContact,
  longitude, latitude, baroAltitude, onGround, velocity,
  trueTrack, verticalRate
] = state;

return {
  icao24,
  callsign: callsign?.trim() || null,
  originCountry,
  position: { latitude, longitude },
  altitude: metersToFeet(baroAltitude),
  speed: msToKnots(velocity),
  trueTrack,
  verticalTrend: verticalRate > 0 ? 'climbing' : verticalRate < 0 ? 'descending' : 'level'
};
That mapping step matters more than it looks. It is where the product gets its shape: units become legible, fields get names, and the UI stops asking the frontend to guess what a number means. In practice, this is how raw telemetry becomes a dashboard.
Why the frontend feels fast even while it keeps polling
`useFlights.js` keeps the interface on a steady 15-second rhythm. It also uses `AbortController` so a stale request can be canceled when the user switches regions, which avoids the classic race where the wrong response arrives last and wins.
That detail is easy to miss, but users feel it immediately. The UI does not flicker between regions, and it does not fight its own state. It just updates.
The map is doing more than drawing markers
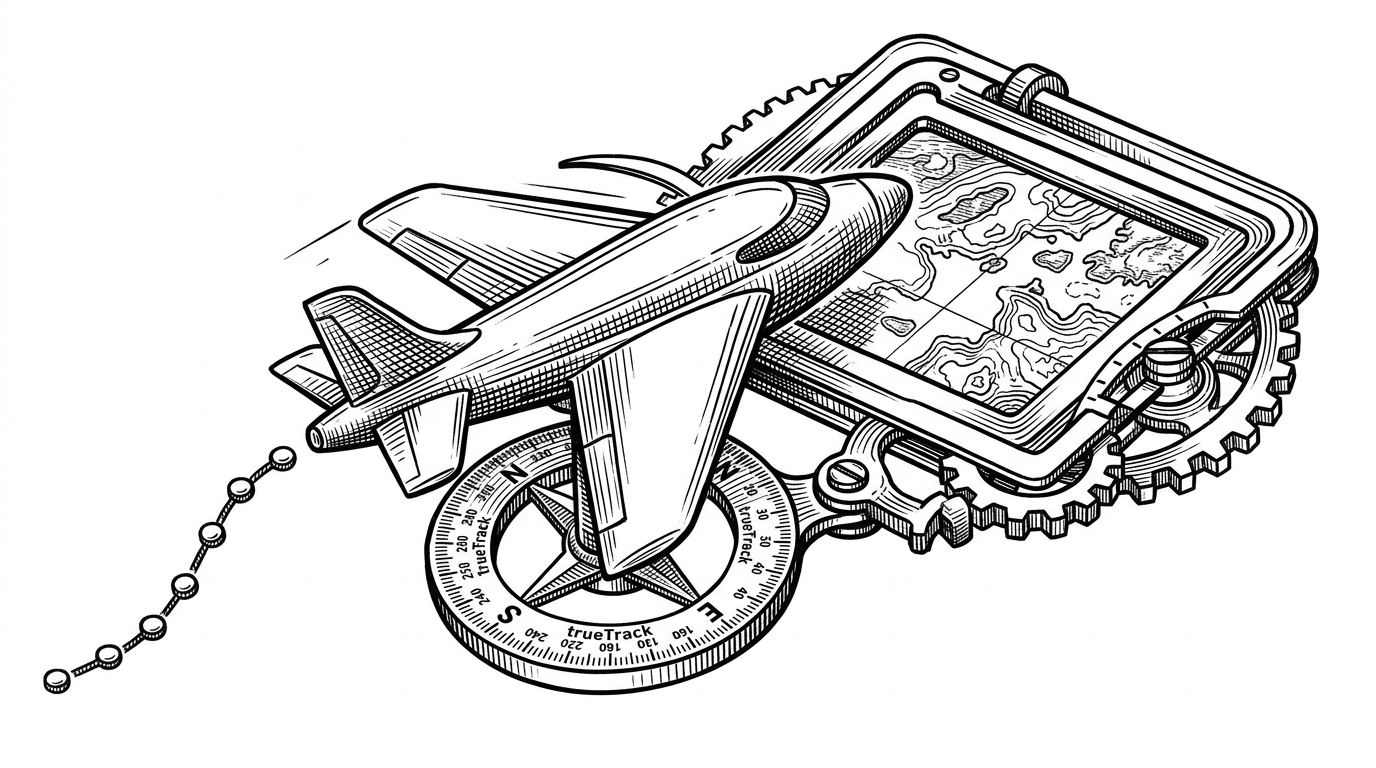
In `FlightMap.jsx`, the useful idea is not the basemap itself. It is the behavior layered on top of it. `FitToFlights` keeps the viewport honest, and `createAircraftIcon` turns each plane into a CSS-driven marker that rotates with `trueTrack`.
That makes the map feel alive without adding visual noise. The interface is doing just enough choreography to keep the user oriented, and no more.
The breadcrumb trail is the cleverest visual trick
Because the backend is stateless, the memory lives in the client. `useFlightTrails.js` keeps a short history of positions, checks whether the aircraft actually moved, and caps each trail at eight points. That is enough to imply direction without turning the map into spaghetti.
It is a small piece of design with an outsized effect. SkyTrack gives motion a memory, but only a little one.
Why this is a better portfolio project than the usual dashboard
| Typical dashboard | SkyTrack |
|---|---|
| Fetches live data and hopes the API stays available | Wraps the upstream source in cache, fallback, and normalization |
| Pushes failure handling into the browser | Centralizes failure handling in a server layer |
| Shows a map with markers | Shapes the data, manages polling, fits the viewport, and preserves trails |
| Looks interactive | Behaves resiliently |
That is why this repo stands out. It is not trying to win on feature count. It is solving the annoying parts that usually get ignored: rate limits, stale data, request cancellation, unit conversion, and display logic that does not fall apart under load.
A lot of portfolio projects demonstrate that someone can wire up a stack. SkyTrack demonstrates that someone understands how a live product fails, and how to keep it useful when it does.